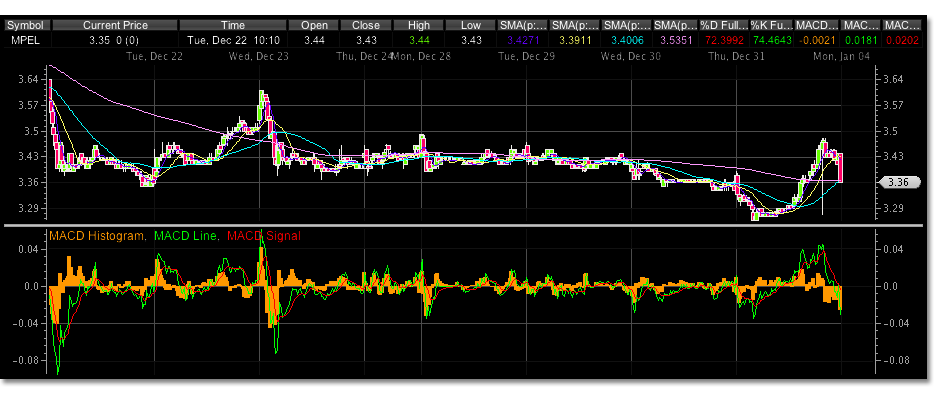
MPEL traded close to average volume today in a low volume market and held up nicely. Last week we wrote that the 3.34 low may be taken out because a possible wave three test at the 60 minute trading time frame was questionable, yet a turning point over a larger time frame may be eminent. Yesterday and today the 60 minute MACD dipped hard and MPEL traded off to its low of 3.26 then rebounded 6% to 3.48.
An interesting chart to watch for shorter term traders is how the 5 minute chart reacts to this latest bounce. The current bounce has so far mimicked the move we saw last week. The chart below shows a 5 minute trading time frame candlestick chart on a 7 day duration period.
The yellow line is the 20 day sma, blue line is the 50 and pink is the 200. Elliot wave counts aside, you can see that in the first low at the left of the chart (after an extended or valid trend line sell off) the cross of the 20 over the 50 signaled a buy. If we look at the first peak after this low we can notice that the cross of the 50 and the 200 signaled a sell.
Moving to the next low, todays low, we can see the same set up. The 20 crossed the 50 and a buy was on. Now the question is as the 50 is about to cross the 200 will a Monday bounce in this stock signal another sell off, or will the successful retest in the larger time frames MACD’s (specifically 60min.) hold up and a longer wave sequence continue?
After hours trading today is already pricing in a 62% retracement of todays move.

