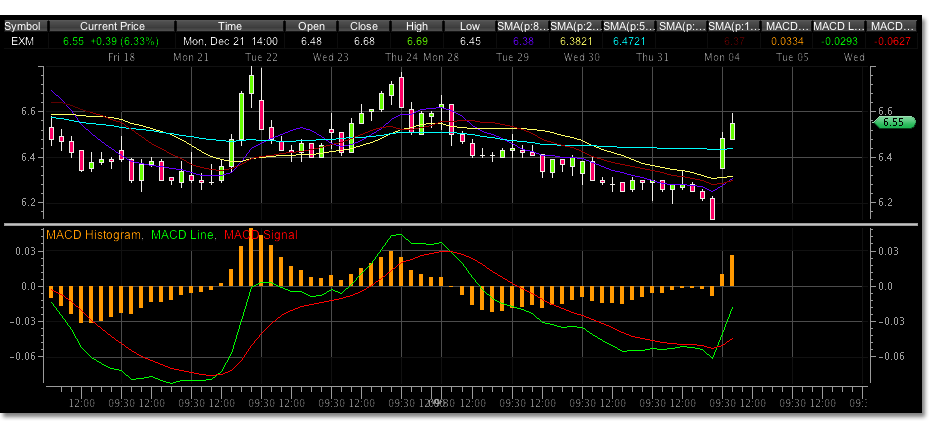
EXM is making tight stops trigger some small losses for conservative longs, however this stock may just still be in the more frequent stage of shake down that is being noticed in many stocks before turning points. In my mind, Exel Maritime has completed its correction. The stock seems confused.
It traded down to 6.29 our 62% retracement level on Decemeber 14, 2009. Then tested that level at 6.34. Then the very next day took that low out at 6.25. Then again tested that level the very next trading day to a penny at 6.26 and traded nicely higher. All of these moves at this stage in EXM are signaling possible continued momentum in one direction or another, but a look at the longer term charts shows us that it should be to the upside.
Finally, EXM trades another 7 trading days to test the low again…and takes it out. This past Thursdays year end close hit another low in the attempt to start a wave 1 to higher levels at 6.13. This seems to be constant shake downs compared to “a” shake down but it is reminiscent of the trading action in many stocks and more and more expected.
This weekend I was reading an article in SFO called Adapt To Survive High-Frequency Trading by Mike Bellafiore. Part of this article got my head nodding as it was exactly what I had been telling myself, exactly what I have been trying to adapt my trading signals to. Although sometimes unsuccessful, my conviction was to the indicators rather than this shaky trading action.
More simply put, the article stated a new thought process to adapt to or at least recognize, the “buy-the-new-low program”. It was nice to know that others are recognizing the efficiency in which price motion is seeking out technical levels and that at times there are inefficiencies or discrepancies due to programs or maybe news flows that seem to abort what technical traders base there decisions on.
Back to EXM. At todays open EXM traded up almost 7% off this latest 6.13 trading low into oil prices rising. NAT also traded higher. There is sure to be a correction at some point of this move and I would continue to trade it to the long side with a stop below the previous low…despite the shake downs. There is a downtrend line from the 8.40 level that this recent trading level high is bumping up against. If the trading brakes this line it would likely trade to the daily 200 day moving average around 7.20 before the correction we want to use to get in.
The 60 minute MACD is showing a nice divergence between a possible wave 3 and wave 5, which would indicate that this latest pop could be a wave 1 and a larger move higher possibly for the next 7 to 10 days before the correction to test the latest low. This may indicate the move through the downtrend line to the 200 day moving average, another 10% move.

