JA Solar has been on a tear of recent weeks, racking up a gain of almost 125% in just 5 months time. Despite being initially stopped out of our trade in August 2009, JASO has continued to trade higher to short and long term price targets.
Just today, JASO received a downgrade to Hold from Buy by Auriga. This has sent the stock lower almost 7% so far today. JASO is up almost 25% in the last 5 trading days. A look at the JASO chart shows what could be developing for JASO in upcoming sessions.
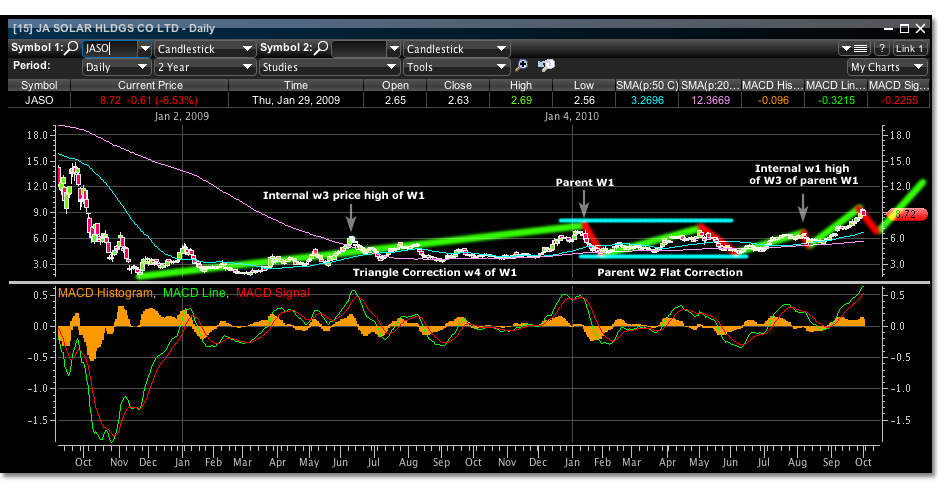
Starting all the way back in November of 2008 at the 1.55 price low, for the bullish case, is a possible wave 5 low and a price zero point to reference for the following trend higher that JASO is in at present. If the recent 9.47 high is significant, where does it fit into the wave count of the JASO chart and what projections can be made?
There is a fairly strong correlation to an Elliott Wave sequence that would begin from the 1.55 low mentioned and complete its first parent wave sequence at the price high of 6.95 on January 6, 2010.
The 1.55 price low is followed by a wave 3 internal price high of 6.29 on June 10, 2009. A wave 4 triangle formation follows. The A wave comes close to projections at 3.22 actual and 3.37 projected. But after its completion, wave 5 appears to begin at 3.57 instead of a projected 4.46 E wave of the triangle formation. The internal wave magnitude of wave 1 of wave 5 internal of parent wave 1 is from 3.57 to 4.54. This calculates to a price point of 7.07 for wave 5 of wave 1 parent and correlates to the 6.89 price high on January 6, 2010.
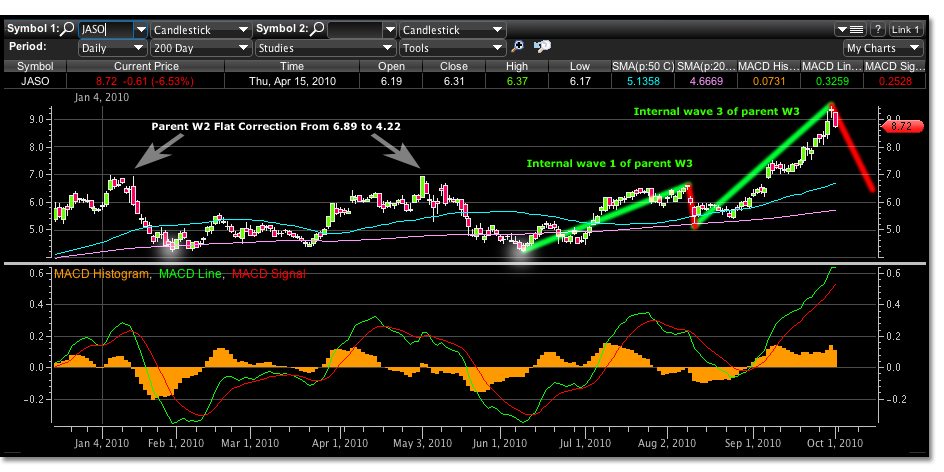
From this point if analysis is correct a correction of parent wave 1 would occur. The JASO chart shows a flat correction forms. This is when the price motion forms a channel from the previous high to a determined low and then repeats this price motion. You can see that after the 6.89 parent wave 1 high, JASO trades to a low of 4.22 on January 29, 2010, then back to 6.92 on May 3, 2010, then again back to 4.22 on June 9, 2010.
JASO then begins to trade its internal wave structure of parent wave 3. Wave 1 magnitude from 4.22 to 6.61 on August 9, 2010. Wave 2 is somewhat shallow correction reaching to price point 5.27 instead of a projected 5.13. Wave 3 is the most powerful of all Elliott Wave structures. The projected price point for wave 3 of parent wave 3 is 9.56. If the preceding analysis is correct this would explain the price motion of JASO to the present high of 9.47 on September 30, 2010.
Since the internal wave 2 correction was not as large as expected, it is possible to see a wave 4 internal correction that reaches to 6.27. If demand is high and market pressures are bullish, 7.52 could be a possible shallow correction price point but not expected. Wave 5 internal price target of parent wave 3 is 12.86. From this point a large parent wave 4 correction will occur.
Since parent wave 2 was shallow, a flat correction, it is expected that parent wave 4 will be a larger triangle correction.


