Wed November 17, 2010 JASO traded to a low of 7.12. Since this low JASO has rebounded 7.5%. JASO traded to 7.18 testing this low at the close of the following day.
A little more backtracking on the prior update, to figure out the 10.24 high on 10/15/10 revealed another Elliott Wave count to consider. The analysis of the 7.12 low relative to an internal correction wave 4 low, still stands.
In the initial wave scenario, daily charts were being used to determine the significance of the 9.47 high on September 30, 2010. However, a quick look at the weekly chart likely explains the 10.24 price target.
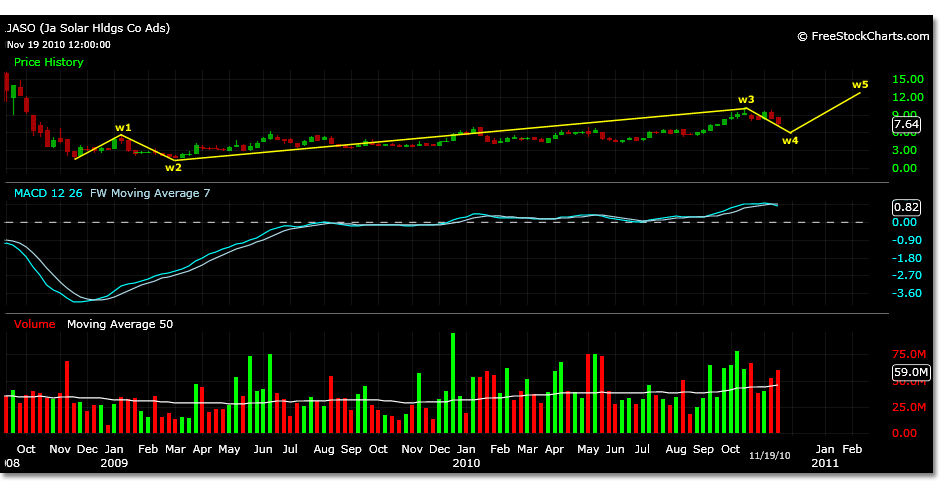
Looking at a weekly chart JASO has just completed its internal wave 3 of wave 1. The weekly chart wave 1 magnitude trades from 1.55 to 5.38. Wave 2 corrected almost 100% to 1.77. Wave 3 projection at this time frame was 10.11.
The weekly chart wave 4 projected price target is 6.84. The wave 5 projected target, if a 5 wave uptrend is intact, is 15.40.
The 12.73 price target mentioned in the previous post explaining the 7.12 low will be a wave 3 internal of the larger weekly wave 5 price motion.
There are other lower price targets mentioned at 6.24 and now 6.84 that may need to be traded before the uptrend continues for JASO.

