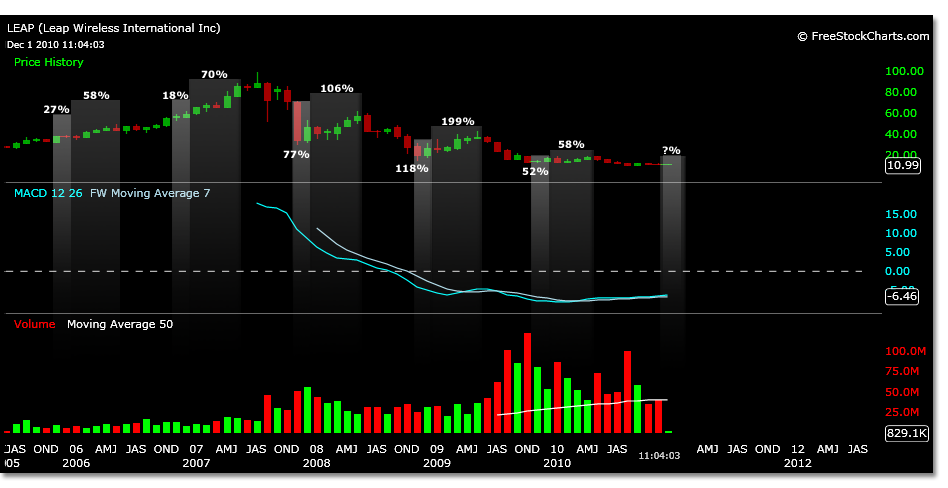
From July 2005 to the present day, LEAP has traded in 5 “holiday seasons.” This will be the time frame from November to the end of the year. After initially mentioning the seasonal move that similar stocks make during this time of year, they all have performed rather poorly. Till today, December 1, 2010.
A look at LEAP historically during this time frame shows 100% correlation to an uptrend during these months. This is still not something to buy into blindly, but it is worth realizing in addition to either supportive technical analysis or contradictory price motion to expectations.
Reading a monthly chart from November 1st to January 1st in each of the 5 prior years, starting with the lowest price in the month to the highest price in the month, LEAP’s performance breaks down into the following results. A second performance rating is shown from November to May of the following year.
2005
Nov 1 – Jan 1– 31.15 – 39.45 27%
Nov 1 – May 2006 – 49.20 58%
2006
Nov 1 – Jan 1– 52.17 – 61.90 18%
Nov 1 – May 2007 – 88.95 70%
2007
Nov 1 – Jan 1– 29.87 – 52.91 77%
Nov 1 – May 2008- 61.67 106%
2008
Nov 1 – Jan 1– 14.18 – 30.92 118%
Nov 1 – May 2009- 42.47 199%
2009
Nov 1 – Jan 1– 11.98 – 18.22 52%
Nov 1 – May 2010- 18.95 58%
2010
Nov 1 – Jan 1– 10.83 – ?
Nov 1 – May 2011- ?
These dates although “seasonal” are not hard to find even if you were looking at a chart with no time frame depicted. They are roughly the highs and lows regardless of trend.
LEAP has made a 263% gain since its IPO to its peak in 2007 and a 815% decline from this peak to the latest low this November 2010. Each year, whether part of the uptrend or downtrend, LEAP has performed well during the given time frames as shown. Although it is obvious of late that holding till May in 2010 did not provide much upside compared to previous years.
Is this luck? The probability of what has happened in the past is 100%. This reality is based on the present observations of the past. The certainty of a future trade, its probability, should be based on the present outcome. This means trade in the present. 5 for 5 has had a nice ring to it for anyone trading these trends, but holding onto past performance will not refund your current trading losses.
The trading low of 10.83, if it holds, is significant in that it is penny above a possible internal wave 2 low, which would keep the uptrend sustainable. A target range of 10.90 was previously mentioned based on an internal wave structure. LEAP also needs to regain its trend line around 11.14.

