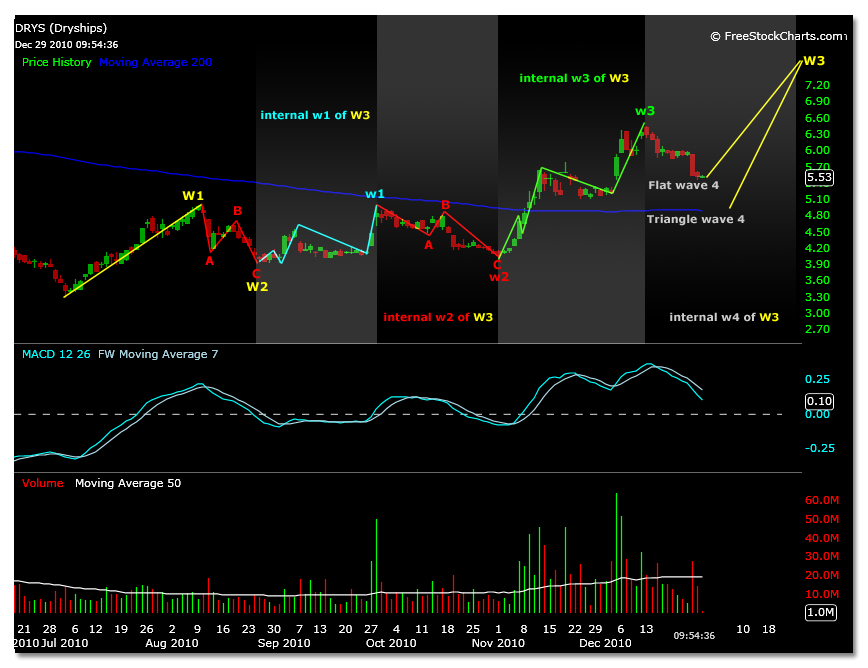
DryShips has been trading poorly since it traded to 6.44 on 12/13/10. Many following the stock are expecting more upside, however the recent correction is certainly bringing skepticism to a prolonged DRYS uptrend beginning.
A look at the daily chart shows good volatility for internal wave structures to the larger anticipated trend and what could be happening in DRYS currently.
This is just one Elliott Wave scenario based on the structures that can be reasonably viewed at this time frame. The final wave 5 of the targeted wave 3 is always developing based on the present price motion.
The parent wave 3 projected target (followed in yellow type) is 7.10. The internal wave 1 of 1 of 3 structure projects the parent wave 3 target to be 7.32. This second target is developed from a wave 1 magnitude of 3.92 to 4.18, shown as the first internal wave of the light blue wave structure.
The chart below also shows the internal structure of the parent wave 3 developing. Right now, DRYS is possibly in its internal wave 4 of 3 structure. Two scenario develop for this wave.
The first is where DRYS is trading today, with support at the 5.47 price level. A break of this level, or the projected flat correction target of 5.39, would likely solidify a triangle correction. Triangle wave 4 correction targets are 4.88 using actual, and 4.84 projected.

