
This stock made a short juke downward triggering a sell stop just after a buy signal was issued mid December 2010. Today the short term profit level was met with accuracy relative to the day’s high.
Being stopped out can happen a lot when trying to time larger time frame trends with shorter time frame sell stops. The advantage is a very small loss if unexpected events occur or analysis of the stock is wrong. The disadvantage is a shake out before a move higher. However, the initial opportunity almost always presents itself again if the analysis was correct.
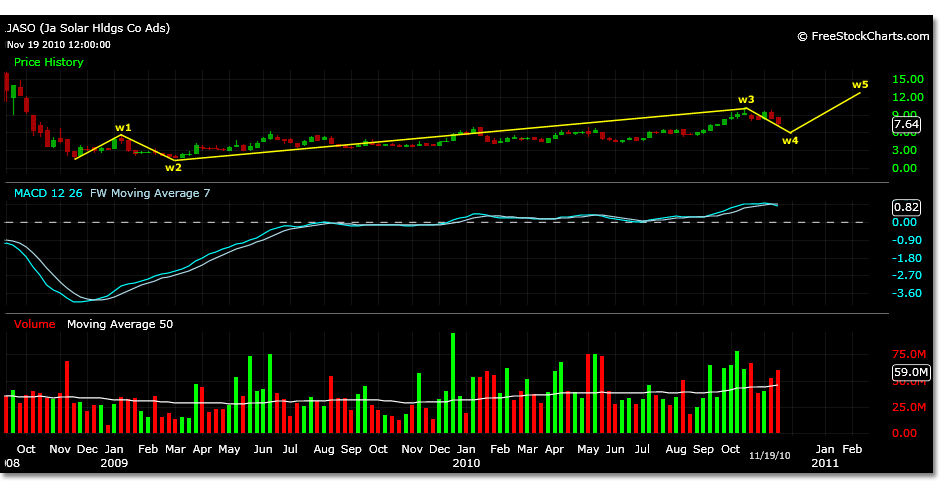
A fairly tight sell stop was used on JASO below a weekly flat wave 4 correction price that was thought to be established. This low got taken out, as the stock traded to the stop price exactly, but the stock did nothing. That is, it did not trade significantly lower or even attempt to trade to its 200 day moving average 3% below.
When something like this happens a trader may again initiate the trade with the new low as a sell stop. Doing so in this case would have meant entering the trade after the 6.64 low on 12/20/10 was successfully tested on 12/29/10 with a low of 6.70.
On a weekly chart, the 10.24 high on 10/14/10 is a wave 3 from the wave 1 magnitude of 1.55 on 11/21/08 to 5.38 on 1/9/09. The 6.84 level that was previously established as a initial buy target, and the 6.64 low that has since held, is roughly a 38% retracement of this long term move.
Because wave 2 corrected almost 100% of wave 1, the current wave 4, from a weekly time frame perspective, could support this 38% level and higher prices because of alternation of price corrections in Elliott Wave charting.
Though it may be safer to trade JASO even as the weekly chart shows potential for support at a 38% retracemtent and higher price projections towards 15.00.
It is worth mentioning this because technically this 38% level was exceeded. When this happens, a triangle correction is expected and perhaps the current move higher is corrective to lower prices (a 38% correction using actual prices calculates to 6.89, 6.82 projected).
Previous analysis on a daily time frame, which could preempt the slower moving time frames readings and analysis, suggested that the current correction is an internal wave 4 of an incomplete parent wave 3 and that a triangle correction is expected at 6.27.
This price is almost 6% lower than the 6.64 low and 3% lower than the 200 day moving average and a fairly large percentage to have to ignore technically. You should always trade the present however, and since presently JASO is rebounding, the next price level to watch is 8.98.
This price level is a .618 retracement of the prior correction from 10.24 and also could present over head resistance. On a weekly time frame this price level is relative to the 200 day moving average and where selling had accelerated into the current lows.