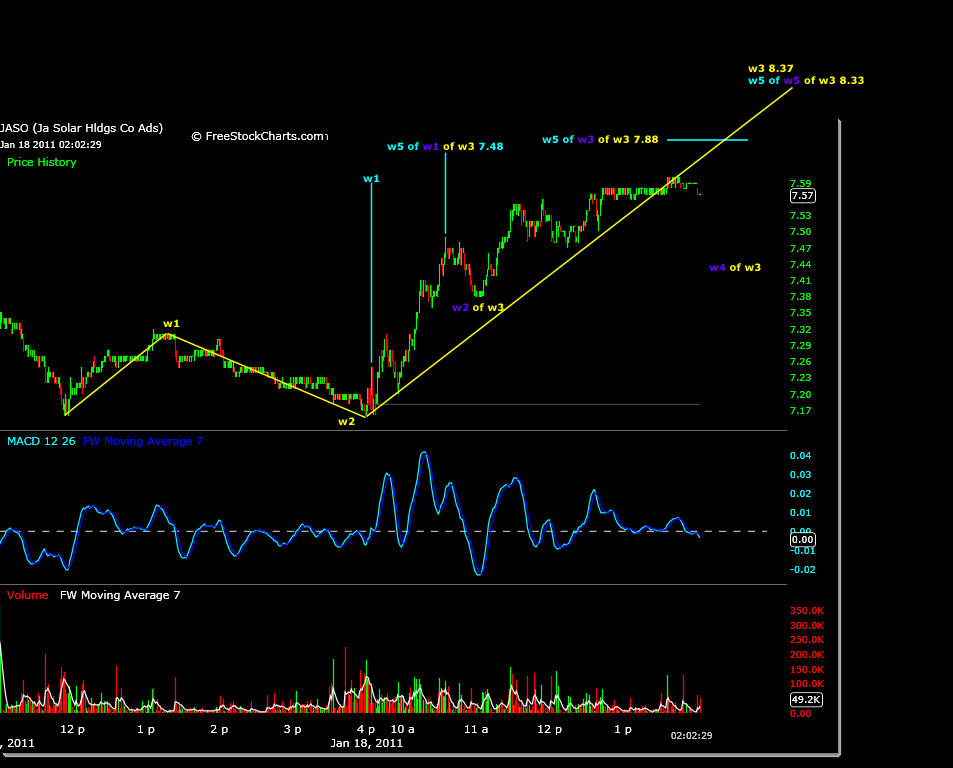
Last week JASO was a part of a new buy signal.
Today, JASO has traded 5.5% higher and is illustrating the price motion that traders using Elliott Wave analysis should be aware of and try to locate in the equities that they are trading.
Without going into the prior buy signal issued late 2010 and the previous wave sequences, take a look at trading from just this past Friday January 14, 2011 up till the present on a minute time frame chart.
There is a low of 7.16 at 11:55 on 1/14/11, this low could be significant to the larger uptrend and was spotted as a possible wave 4 correction retracement.
From this low JASO trades to 7.31 in the afternoon, then closes sharply lower but does not break the 7.16 low. This is what someone trading Elliott Waves would look for in a wave 1 scenario.
First, try to establish where a new price zero point will occur, that being the larger trends wave 4 retracement. Monitor this price point for successful fibonacci wave 2 retracemtents up to 100%.
Because JASO has so far successfully held the 7.16 level, 7.16 to 7.31 becomes the initial wave 1 magnitude of the current parent wave that JASO is trading. In turn, todays trading becomes the internal wave 3. If the volatility is sufficient, you may be able to count these internal waves with relatively good detail. That is what we’ll try to do here.
Below is a 1 minute time frame chart from 1/14/11 till the present. It shows the initial wave 1 spoke of above in yellow, then todays trading begins. Internal waves are labeled in the blue and these internals parent waves are marked in purple.
If the initial wave 1 magnitude of 7.16 to 7.31 is used to calculate a 5 wave sequence, 7.70 is the parent wave 1 target and 8.37 is the parent wave 3 target.
Now move to the internal wave 3 structure that has developed today, and see how those projections compare to what is/has happened in real time.
Todays low of 7.16 was tested after a high of 7.25 was traded in JASO at the open. This successful retest of wave 1 internal of parent wave 3 sets up a new 5 wave projection.
Calculating 5 parent waves using 7.16 to 7.25 as internal wave 1 of parent wave 1, three bullish price targets are generated. Parent wave 1 projects to 7.48, parent wave 3 is 7.88, and parent wave 5 is 8.33.
JASO has already traded to the 7.48 price target and corrected to 7.38, two cents off a 38% fibonacci retracement. It is likely that the difference between the 7.70 price target and the 7.88 price target correlate to an internal structure of a wave 3 and wave 5 of the parent wave 1.
Also notice that the current internal waves parent wave 5 target is very accurately projecting the same parent wave 3 price target of 8.37, only 4 cents off.
Finding correlations like these are key to market timing and knowing when to enter and exit trades, as well as measuring the accuracy of price motion volatility compared to each trades expectations.

