JASO has made a nice correction from its highs and been a very volatile stock the past month off recent lows.
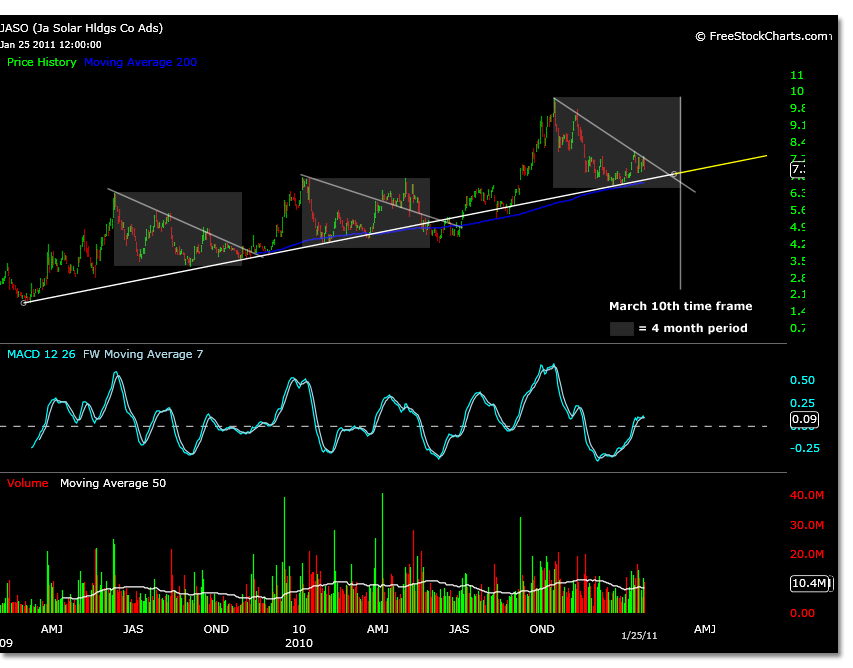
Technically trading along its long term trend line, shown in the chart below, JASO has made calculated moves higher within a specific duration period.
The indecision of the current triangle formation is in question due to the fact that the current move does not correlate to past duration periods.
However, the past two duration periods have split decisions on new price lows. The accuracy of this indicator is likely to only be added resolution to a broader trading analysis.
In the first instance, a higher high was not made before the time frame was complete, but a lower low was also not made after the long term trend line was tested. In the second occurrence a higher high was not made before the time frame was complete, but a lower low was made after initially testing the trend line.
Each shaded area in the chart represents roughly 4 months of trading. After each duration period JASO has made an accelerated move to the upside. This is shown on a daily time frame chart.
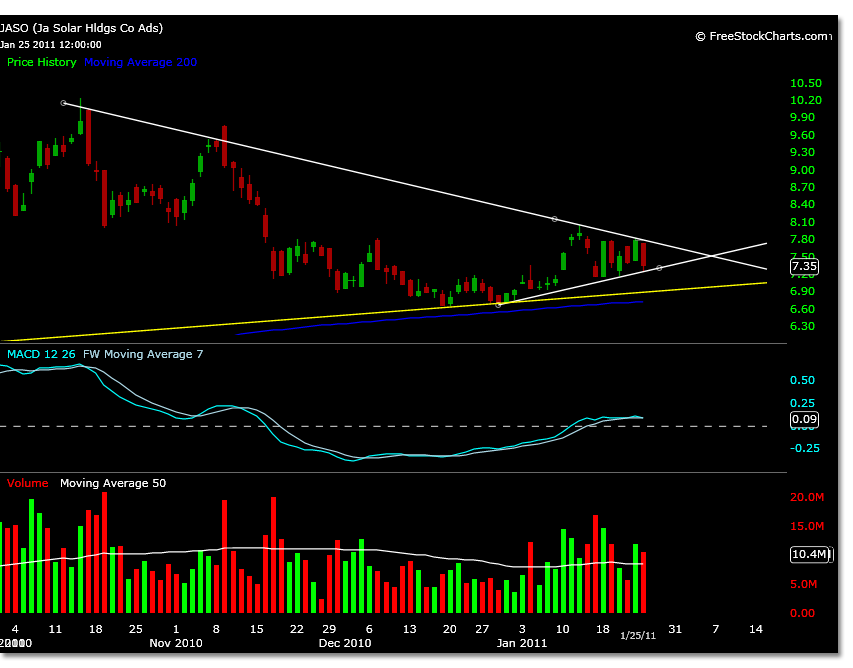
Currently this time frame is expected to end in the beginning of March 2011, but JASO has recently shown strong signs of continuing higher off the 6.64 low on 12/20/10.
Since this low, JASO has traded within a triangle formed from its previous highs as it has in the past. Some of these sloping lines have not contained prices exactly, however in each instance of a sharp move higher in the stock, the duration has correlated rather closely to the beginning of the largest move.
On a shorter time frame chart (30 minute) it can be seen that JASO has not yet violated the extremes of the trend lines, yet which way the triangle breaks is again the question.
It could be possible if this indicator is to work a third time, that JASO again corrects to its long term trend line, perhaps the 200 day moving average. In prior instances it appears that JASO has held this line a longer period of time before making substantial moves higher.
There are certainly higher price targets expected from previous analysis, but also lower ones that are within reach if JASO overshoots to the downside as it has done in the past.
This alternate duration period scenario should be used as additional awareness to any price action to the downside. As well, if JASO breaks to the upside before reaching the expected duration, the prior price target of 8.45 may be a level where prices are contained.


