JDSU has really heated up and was an over performer in the telcom seasonal trade issued in mid November 2010.
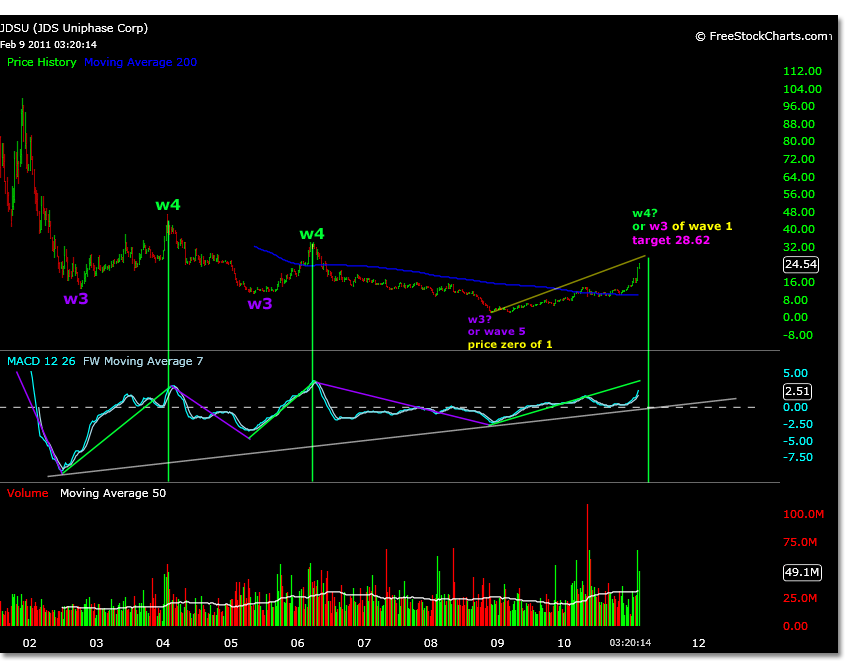
This analysis of the JDSU weekly chart from 2002 explains a possible Elliott Wave count for JDSU, and clarifies the previously stated 28.00 price target mentioned. To be exact, 28.62.
Looking at the weekly chart below it is obvious that JDSU has been in a long downtrend. When counting an Elliott Wave in a correction, the wave count is reversed.
The waves that carry the momentum are to the downside so that waves 1, 3, and 5 will be downside targets. Waves 2 and 4 will be corrective waves to the upside since the trend is down.
Subsequently when analyzing a chart for an Elliott Wave pattern you try and isolate wave 3’s from wave 5’s, doing this with the help of the MACD.
Wave 3 will always be the largest wave. If we realize that the trend is down, then the corrective wave that follows wave 3 MACD will be a wave 4.
There are normally two corrective waves to a trend, and this trend is down. Two wave 4 tops have formed with lower price lows following the point of greatest momentum shown in the MACD. These points are in themselves wave 3’s of a wave 5, but their divergence can only be within wave 5 itself.
The ultimate wave 5, technically, should resolve itself after two corrective waves form (two wave 4’s) and divergence between each wave 3 of wave 5 in the MACD is maintained and tested significantly.
The JDSU weekly chart shows prior divergences in MACD were not of wave 3 and wave 5, as lower lows in price occurred. A lower low will not occur after a true divergence.
The question now is whether or not JDSU is setting up another wave 4 corrective wave, or if the low of 2.01 set on 11/24/08 was the final wave 5 of the correction.
Was the divergence between the potential wave 3 and wave 5 significant enough to set up a price zero point for a bullish 5 waves higher? If so, a possible Elliott Wave count from the p zero price of 2.01 is marked in the chart below.
The initial internal wave 1 of what could be parent wave 1 is calculated from 2.01 to 5.30 on 1/7/09. This is internal wave 1 of 1.
If this is indeed a bullish Elliott Wave trend off a bottom, then 5 parent waves will form. These 5 parent waves will then in themselves be a wave 1. This concept is represented by the yellow type.
The light blue mark up shows the internal waves of parent wave 1. The parent wave 1 target is shown in orange type. Parent wave 2 red type- a 38% correction. The projected parent wave 3 is shown in pink.
The parent wave 3 represents the 28.62 price target, derived from the internal wave 1 of 1 magnitude (2.01-5.30).
It is also worth noting that the parent wave 1 price high of 13.95 on 4/16/10 is only .04 cents off a parent wave 1 calculation using the internal wave 1 of 1 magnitude.
There is good correlation here so far to suggest that a parent wave 3 price target will be met. The MACD also verifies this to be occuring. Whether or not a wave 5 will develop, or this is another wave 4 top, is left to be seen.
Currently JDSU could be trading at a projected internal wave 3 of parent wave 3 which calculates to a price of 23.98.
Wave 4 internal of parent wave 3 could correct from 21.25 – 17.73, before heading to the internal wave 5 parent wave 3 target of 28.62.
Price corrections at this point will be very hard to determine before meeting upside targets due to the lack of volatility.
If this parent wave 3 target is met, a parent wave 4 correction could reach to 12.24 as a triangle is expected.
Continuing quickly through the internal waves of parent wave 5 projections not shown in the chart. Internal wave 3 of parent wave 5 projection is 34.88.
This 34.00 range is a figure that is being thrown around as a potential near term target by others, as it is relative to the 2006 price highs, although it could be a painful ride to this price from here.
Parent wave 5 price projection is 45.07.
All of the future price projections are contingent of market dynamics at this point. An analysis for a bottom in JDSU has been derived, as well as a possibility of further lower lows.
If initiating trades now based on technical indicators only, it is suggested that traders use discretion in their entry and exit points to not only protect profits and losses, but to remain disciplined to a concept of trading time frame.
It has taken 2.5 years to get within arms reach of a possible parent wave 3 target.
Wave 3 is the strongest of all 5 waves.
Wave 4’s are normally the longest of the wave formations to resolve themselves and are often loosely formed with indecisive price motion.
Wave 5 caries less momentum than wave 3 by definition, and is the most likely to underperform after a strong or over performing wave 3.


