
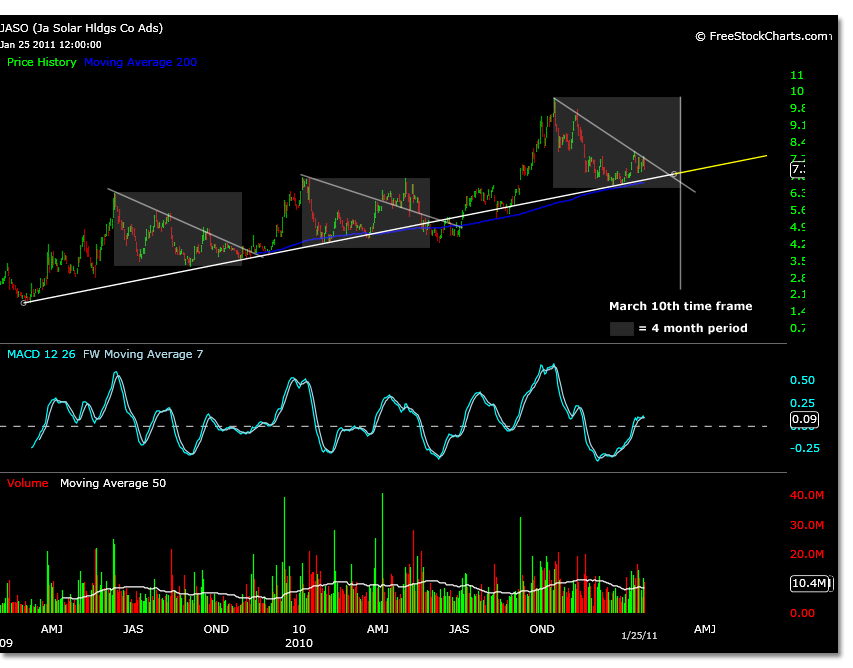
Following up on the post that was written in late January 2011, JASO is now exiting a four month duration period in price motion.
The previous chart markup from the duration analysis on JASO shows an estimated date of March 10th for JASO to establish a new turning point low.
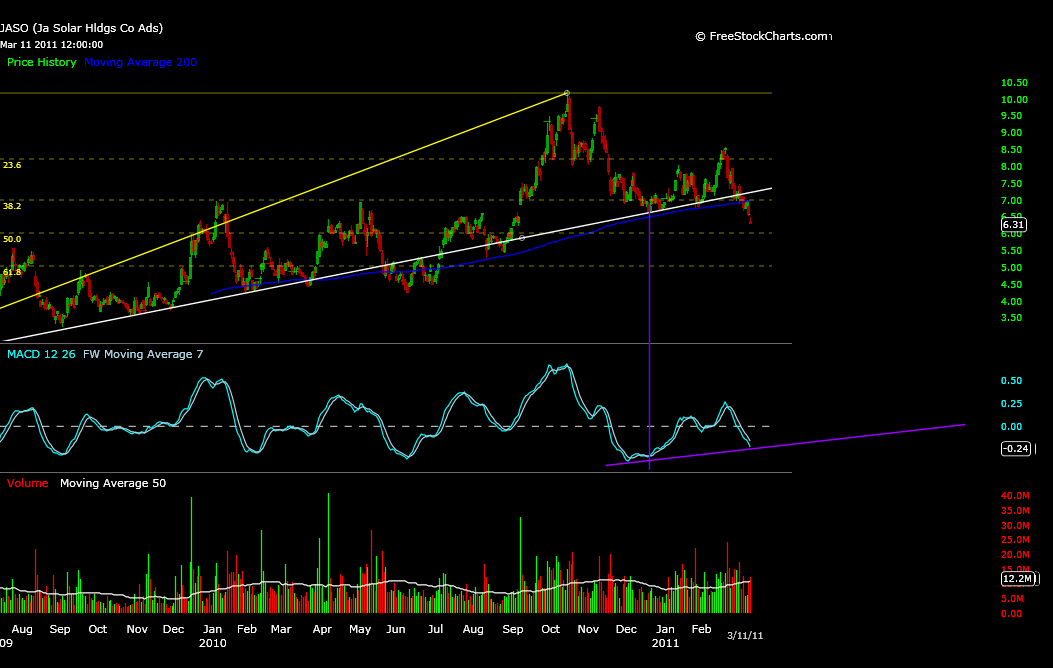
A look at the daily time frame chart currently shows that JASO has broken the uptrend line as well as its daily 200 day moving average.
On March 10th SST posted a chart that showed the 2 day time frame, and the possibility of support below the current trading price at the 200 dma using this larger time frame.
The current 2 day chart shown below is marked with Fibonacci retracement levels from the initial move off 1.55 low, as well as the daily time frame trend line shown in white.
The purple lines show MACD levels being highest at a wave 3 count in an Elliott Wave structure marked with white text.

This MACD reading correlates to the mathematical calculations for a wave 3 top using 1.55 and 5.38 as the magnitude of parent wave 1 with high accuracy. Wave 3 price projection was 10.11.
If the JASO chart is in fact correcting from a wave 3 as it appears, a look at the price motion from the 10.24 high to the present can reveal a few clues to what has developed.
First, JASO was expected to correct 38% because the wave 1 correction was so severe. It is easy to see that JASO tried to hold this level initially. This is shown in the price breakdown within the circled area of the chart below.

As soon as this breakdown occurs subsequent levels of support and triangle correction projections should be anticipated.
A triangle wave 4 has a few target correction percentages that are common, 46, 53, and 618.
The 46% correction calculates to 6.24, so there is possibility to create turning point at Fridays low of 6.26 from a technical point of view as well as using duration period.
There is however other characteristics of an A wave low of a triangle correction to consider besides percentages. If anticipating a triangle, the A wave will carry the most momentum.
Looking at the daily time frame chart, it is clear that the most momentum has occurred at the 12/17/10 low of 6.64. Subsequent lows to date have not created a larger period of momentum viewed at this time frame.
Most call this divergence. That being that a lower low in price occurs diverged from the momentum of price flow shown in the MACD.
If applying this terminology to Elliott Wave formations, divergence only occurs within structures with 5 waves, between waves 3 and 5.
While there can be occurrences of 5 waves in a wave 4 correction, they would occur in the C wave of this correction only, and this correction would not then be a triangle but a simple ABC correction as it appears to be at this time due to the MACD levels.
Putting these things together, the current price low of 6.26 could stand as the turning point low based on divergence in MACD of an ABC correction and the duration period analysis, and would not continue to wave 5 targets in the form of a triangle but a normal 5 wave sequence.
Perhaps this will be the case because a flat correction was expected and the 6.83 price level will be regained in future trading, but lower wave C targets in price can occur within this divergence by definition if the C wave is not complete.
This chart below is the current simple correction if it were to continue with divergence. The end point of C is projected to be supported by the peak of wave 1. In this case the absolute price level of C is not a calculated target just theoretical.

The other realtime scenario that could occur, and to look out for, would be the reestablishment of the triangle wave 4. In this case the A wave has not yet completed.
This would occur if MACD continued beyond the 12/17/10 low reading for MACD shown in the chart below.

This new low in MACD would confirm a triangle correction, and the triangle correction projection for wave 4 using the previous Elliott Wave count would be 4.84.
This is calculated using the 618 level (although other percentages may suffice as noted prior) due to the fact that quite a bit of price deterioration would have to occur from this point to create a larger momentum reading in the MACD daily time frame.
As it becomes more certain that the parent wave 4 correction has completed, parent wave 5 price targets are as follows:
Wave 1 of 5- 9.19
Wave 3 of 5- 12.12
Wave 5 of 5- 15.40