
Aluminum Corporation is a producer of alumina, primary aluminum and aluminum fabrication. They operate in four segments: alumina, primary aluminium, aluminum fabrication and trading.
ACH was targeted on 3/29/11 due to a possible triangle formation near completion.
The following will be rundown of how a possible trading opportunity sets up relative to an Elliott Wave formation since the IPO.
Quarterly
Looking at a quarterly chart shows that the viewable waves, when calculated, add up to a complete five waves even though momentum is not diverging in the MACD.
Quarterly wave 1 magnitude is 2.34 to 23.06 and wave 5 projection is 77.30.
Divergence to this wave 5 projection at this time frame is not as important as the verification of a completed 5 waves, and the lack of MACD divergence is better seen in the weekly chart.

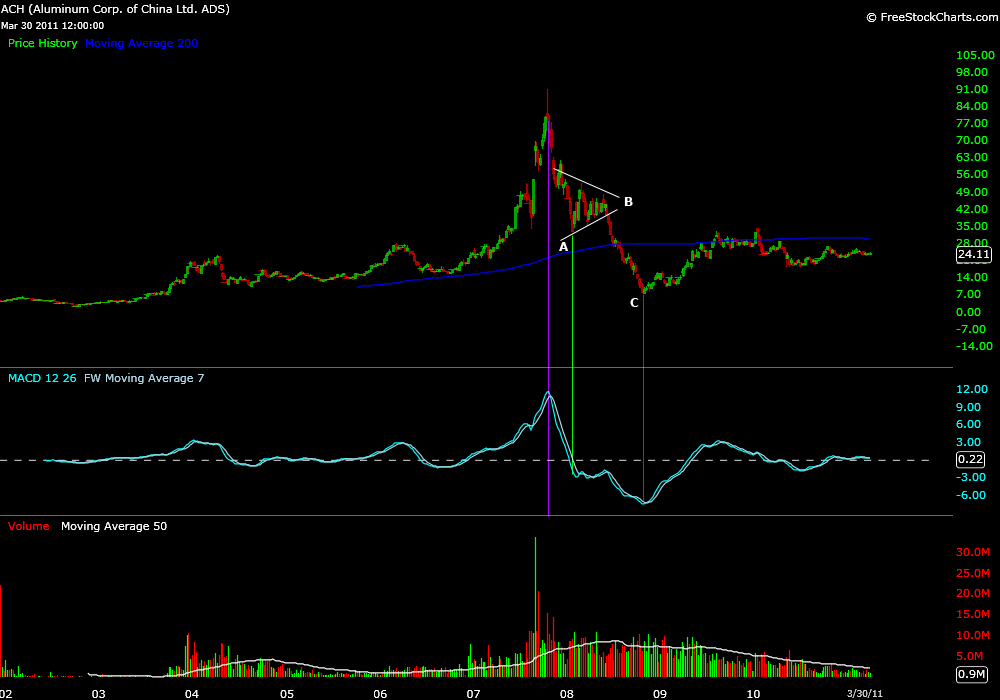
Weekly
The ACH weekly chart shows a huge ramp up in prices, then a crash. The largest peak in price is mirrored by the largest peak in MACD shown with the purple line in the chart below.
This is an indication that this peak in price should be counted as a wave 3.
The green line shows support at an estimated wave 1 price initially, which would confirm support for a 5th wave higher.
The green line also shows correlation to what would have been the largest negative MACD reading,
During a correction of over 38% this should signal a triangle correction. The A wave carrying the most momentum.
A triangle forms, outlined in white trend lines.
In this case the triangle breaks downward, taking out its triangle lows as well as its parent wave 1 highs as support.
This signals ACH is in the C wave of a parent wave 2 correction, not a wave 4 triangle.

What is peculiar about the present analysis to this point is that the final low in price, shown with the red line, is found at the largest MACD reading. This would again signal a triangle correction, confirming the prior wave 3 peak at the weekly time frame in MACD.
This must be due to the lack of resolution at higher time frames not yet correlating to future MACD readings.
The only way that this MACD reading could diverge to show a 5th wave down would be to have a lower low in price follow. This would mean that ACH takes out the 7.22 low and tests 2.34.
A possibility, but not one on the table just yet. In fact many stocks throughout the indexes are in similar situations that have relatively short price history.
Presently the only wave count that ACH can fit, at this weekly time frame, is a wave 2 correction to the 7.22 low.
Four criteria to validate weekly wave 2 scenario
One- that a 5 wave sequence has completed itself at both the quarterly and weekly time frames.
A wave 1 magnitude weekly from 2.34 to 20.60 projects to a wave 5 of 68.40. This brings along the lower end of a two month price range when used in conjunction with the quarterly projections previously mentioned.
Two- that the low of 7.22 in 2008 did not violate the low of 2.34 in 2002 and can be used as relative price zero point. Wave 1 can retrace up to 100%.
Three- a weekly chart shows what is called a triangle wave B pattern that is only found in wave 2’s, where the B wave of an ABC correction creates a triangle formation. (chart)
Four- the confirmation of the largest wave counts are unresolved relative to MACD due to their duration periods, but are confirmed based on internal wave count calculations at the present time.
Daily
We are now at 7.22 low 10/29/08. The trade set up begins.
Looking at the 2 day chart below we again isolate the wave 3 price and MACD reading.
In this particular instance there is proper volatility or resolution to see the divergence of internal wave 3 of 3. The MACD is marked in purple, the wave count marked in yellow.
The white lines outline the triangle that is forming in what could be a wave 4.

So far the lowest wave of the triangle correlates to the largest negative MACD reading shown again in purple. The internal triangle waves are shown in blue.
As the triangle is resolved, wave 4 should end and wave 5 begin.
Based on actual price zero point of 7.22 and actual wave 3 high of 32.79, the E wave of a triangle wave 4 projects to 22.95.
This price is relative to where ACH is trading presently and why a trade was initiated.
A 5 wave sequence from this wave 4 price point would calculate to internal wave 1 of 5 at 30.04, internal wave 3 of 5 at 38.80 and wave 5 of 5 at 48.59.
Collectively these 5 waves would be the projection of internal wave 1 of parent wave 3.
This is what is expected in ACH if the wave A low of the triangle holds. It is important to note that the projected wave A of the triangle was 17.05. Actual was 18.07.
Theory
This analysis, although lengthy compared to the price history of ACH, was necessary.
It may not likely factor into the price action that we are trying to capture in the smaller daily time frame, or at all in future price motion, but it is important to know the history of the chart you are trading before entering a trade relative to your trading time frame.
Although many may find this analysis confusing and lacking realistic expectations, Elliott Waves are undeniably visible characteristics of price motion. How they are used is perhaps what is confusing or disparaging.
The analysis of a wave count, or any price motion theory, can be done 100x faster with the human eye than it can be typed and proprietary calculation software makes running these numbers easier, although its simple math.
Finally, the only way to trade using an Elliott Wave is when price is presently in an Elliott Wave. Never trade on future expectations when they do not match the present.
In ACH we think we are exiting a wave 4 triangle until we are not.