
HL Elliott Wave correlations were drawn out earlier in the month prior to the big ramp up in price.
Some miscalculations were made relative to preparing for the trade, but HL continues to intrigue my interest after smacking the 9.57 target on Thrusday 03/24/11. Read more about that wave count and prior price targets here.
This time round a look at the monthly chart for HL and how this price history feeds right into the present price action.
Monthly MACD and Divergences
Check out the MACD from the far left in the early 80’s. Marked with a purple line in this chart- the “divergence” begins.

Imagine buying this stock off the first divergence, the second, the third, the fourth, as price keeps getting lower with a buy and hold strategy. Ultimately it reaches 50 cents.
This is an important concept that I try to master, at least relative to the Elliott Wave, what is divergence?
Divergence can only truly be observed in a wave 5, between wave 3 and wave 5.
In each of the instances of divergence shown there is a reversal in price, in which the divergence was accurate, but to what degree? It’s a matter of time frame.
An Elliott Wave count for HL begins in December of 2000.
From the .50 cent low to the next tiny little peak in price at 1.06, is what we’ll use as internal wave 1 of parent wave 1. This first wave on the monthly successfully retested the low at .65 cents.
With this magnitude we calculate 5 parent waves. These calculations are shown in the chart below and correlate to the first large peak in price and macd on the price chart for HL.

Comparing the price projections to the actual price chart of HL, 7.83 is a close average for the peak labeled wave 3 in yellow in the chart below.

We label that peak wave 3 and not wave 1 (even though its the culmination of 5 parent waves which we projected) because the peak in macd is the highest at this price shown in purple. The parent wave structure is being highlighted by white type accordingly.
Using the 7.83 projection as a wave 3 internal of parent 1 is shown in the calculations chart below.

The wave 5 of parent 1 then reads 12.36. This projection has a very high correlation to the spires of price shown in the monthly HL price chart.
Most important is the divergence on the macd between 7.83 and 12.36, waves 3 and 5. This signals the top of parent wave 1 and the correct wave count theoretically.
The trauma of corrective parent wave 2.
Normally the usual fibonacci retracements are sought after. Mid 2008 left no holds barred however, and the only rule that held up was- wave 1 may correct up to 100 %.
HL bottomed at 99 cents. This low is the parent wave 2 price zero point.

Heres were things really start to heat up, but don’t get excited about these next projections unless you are very young. Remember it took almost 12 years to get to this point and we’ve gone round trip once on price. If you were holding a large lot of .99 cent shares today-sure why not sell.
The next calculations chart shows the inevitable, what parent wave 1 projects to in 5 waves. This is shown using the projected prices off the .50 cent bottom.

So now we have our parent wave 1 projections using past projected price targets that were met accurately.
Keeping these projected targets in mind, we should now reestablish the price zero point as the parent wave 2 low at .99. This will give a more present time frame magnitude for the wave 1 internal of parent wave 3 and 5.
Using the parent wave 5 projected target 44.58 and the actual low of .99 we create another calculations chart shown below.

The parent wave 3 target remains relative to the larger time frames projection, not surprisingly since the price zero low is practically the same relative to a lengthy time frame.
Now, look at the parent time frames chart and note the price of internal wave 1 of 3; 11.06 projected.
The monthly time frame chart is updated with this projection below.

The price of 11.56 on 1/3/11 correlates very closely to the internal wave 1 of 3 projected from the low of .50 cents in year 2000.
The peaks in price of each calculations sheet shown to this point are relative to the magnitude of wave 1 from the low in 2000. This correlation is what is hoped to be maintained throughout each waves time frame. Wave 1 is the key in each waves structure.
All very exciting, but its the correlation from .99 cents to today that keeps me interested.
Present time frame is the most important.
Moving forward (from the .99 cent parent wave 2 low as price zero) we’ll project calculations using the actual price high on 1/3/11 of 11.56. This is a wave 3 based on the macd reading shown in the weekly chart below.

The calculations for this wave 3 magnitude projected an additional 5 waves is below.

The wave 5 of this sequence is 18.09, which is a close correlation to the internal wave 3 of parent wave 3 based off the .05 low in 2000; shown again in this chart.
These correlations are worth paying attention too, if they continue as noted here, HL could have significant upside to come depending on your time frame.
That said, we are presently not sure if the internal wave 2 of parent wave 3 is completed at the monthly time frame, referenced in this monthly projection chart at estimated price of 7.16.
If the present 7.81 low (met on 3/15/11) becomes the internal wave 2 of parent wave 3 low, then the prior analysis done March 23, 2010 could be leading us into the internal wave 3 price target of 18.09 mentioned above.
The numbers inside the daily time frame.
Off the 7.81 low, project 5 waves to 18.09. The calculations are shown in the chart below.

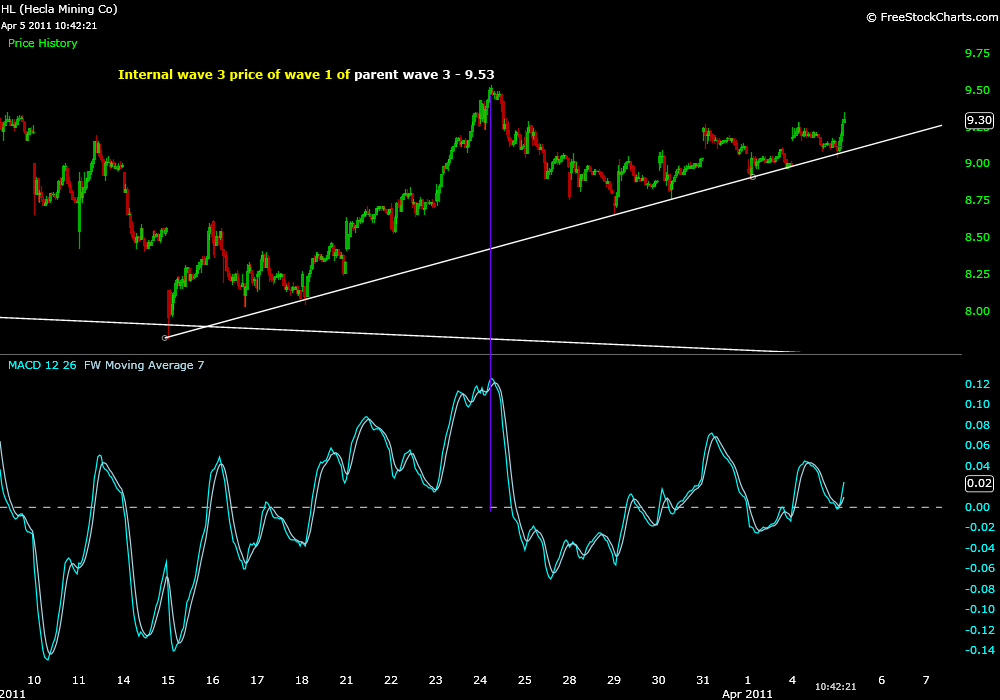
The internal wave 3 price of wave 1 (of what could be a push towards internal wave 3 of parent 3- price target of 18.85) correlates almost exactly to the prior high at 9.53 (chart ) on 3/24/11.
The internal wave structure of this move again outlines relative correlations to the historical price motion of HL. A chart below from the prior post, pre 9.53 high.

A very lengthy post, but it’s good to know where you may be in a trade. We know that HL could go much higher, but we also know that the current correction may not be over at the monthly time frame and we are in a wave 1 of parent 3.
Remember that corrections, as well as the projected highs, are just estimations and relative to market dynamics. If these correlations begin to only represent the future and not the present, then you’re dreaming and likely loosing money.
I built an Elliott Wave calculator that projects these prices. It’s proprietary. I am not just penciling in numbers with relative similarities for shock and awe. I’m sharing them for informational purposes at the moment.
The past is not random when viewed in the present and I think these correlations can be leveraged to a traders advantage if used and observed in the present.
Pingback: StockSignalTrader: Technical Analysis » Helca Mining Co. Anticipating A Trade in HL()