
In late March we started following GOL.
Recently I exited a position started in the initial post as GOL broke 13.60 to protect some profits as well as determine if this downtrend would continue in a channel instead of the wave formation I was trading.

Currently GOL has traded down to where the initial set up began. This is not such a bad thing, so far.

In the initial Elliott Wave projections, wave 4 was to end at 13.237. GOL showing support at this level trading to 13.26 was encouraging enough to again enter a trade.
This price range was suspected to be visited if momentum was not strong enough to continue higher. The amount of resistance from the prior downtrend line was definitely unexpected.
But basically nothing has changed so far. The longer time frame projections are showing support right now which is good and could reverse the daily downtrend.
The shorter time frame targets are being met as well.
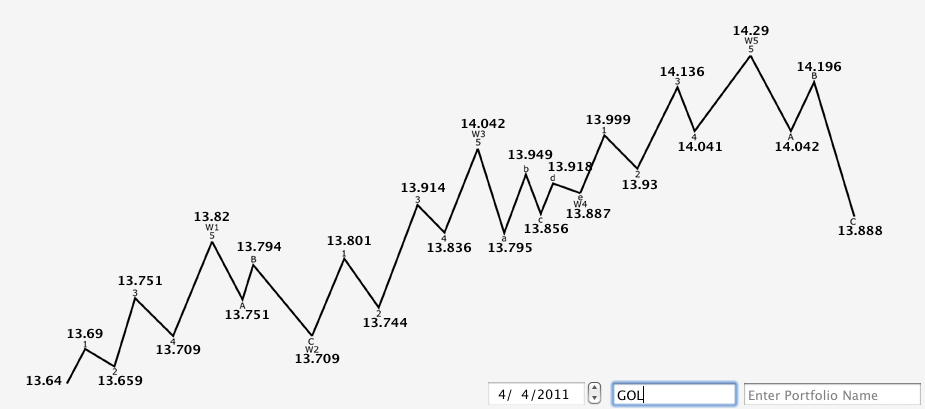
This 14.04 target is right about where the trend line resistance kicked in and was likely, from a wave count perspective, where GOL found resistance.
Where one time frame takes over and the other releases is certainly the disparity of success in the theory, but it can be managed just like any other trade.
Entering a trade here was determined to be a good risk reward scenario if the prior wave counts should continue to play out.