
I’ve rebuilt a position at 13.28. Todays strength is great but I want to again establish my levels. Many things have recently played into the prior wave count and although not lost from a price projection standpoint, certainly the fluidity is lost.
GOL has been choppy lately and watching the market since Monday I believe the S&P downgrade was a random event. Sure it may be no surprise the US got a warning on downgrade, but such an event placed on any day could be called random to me.
In my mind no one was excited to go home short last Friday. Coming into the market Monday and seeing it drastic gap down created a poor opportunity to short at a bottom and many stocks have since proved that whether they were inevitably heading to the respective lower levels or not, the way that they got there was random.
I am interested in buying GOL if it revisits the lower levels and will point these possibilities out below. But the specific levels GOL rebounded to are in line with what was thought to be prior support.
The chart below is from prior analysis and shows what support from the triangle wave E looked like in actual terms, this link shows projected prices.

On 4/13/11 a test of the sell stop at 13.10 appeared to be properly placed. GOL rallied nicely 2.5% into the end of the week closing above prior resistance.
On monday with news of the S&P downgrade GOL at first didn’t exchange any shares for 2 minutes after open. This was interesting but in the end this event caused a sell off to breach the sell stop. This happened as other US airlines were flat to up.
GOL staged a modest rebound during the sell off and on Tuesday regained its support above the wave E price target trading in a range from 13.30 to 13.20 roughly.

At the end of Tuesday half the days daily volume was traded. Today it seems that this was because of a UBS note released stating that shares are trading at an exaggerated discount.
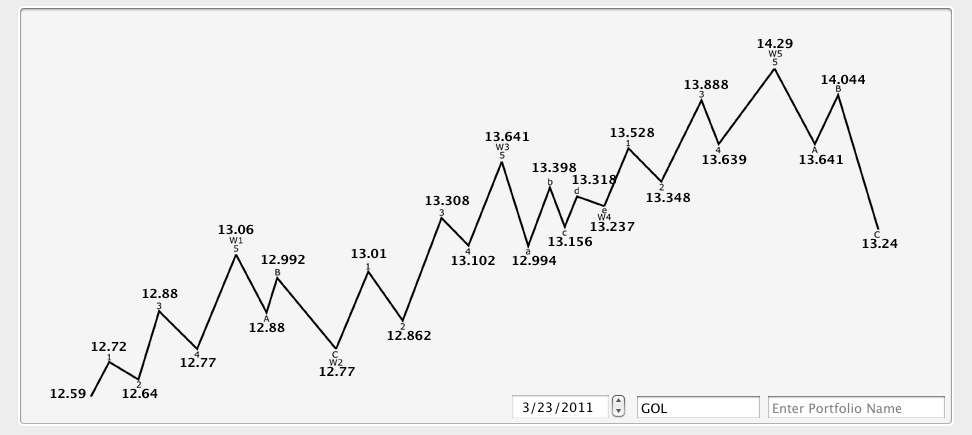
The chart below shows the correction from 10/14/10 projected using a 5 wave Elliott Wave sequence.
Counting a 5 wave projection downtrend is much like an uptrend except the MACD is read differently. Peaks are considered wave 4’s which begin a new 5 wave sequence lower towards the intended targets. This relationship is shown in the purple type.
With that in mind this pop higher today could also be a wave 4 to the lower projected price. Something to consider at least.

12.71 was the internal wave projection of the last wave 4 noted and was met with current lows. This is shown with the orange line.
12.28 is the larger waves projection count and is shown with the red line and has not been reached yet.

The current breakout and gap higher in Wednesdays trading got me to look at how similar breakouts have reacted in the past.
Trading on 8/31/10 and 9/1/10 created a gap that continued for two days and then was filled dramatically on 9/7/10.
Also a gap appears at 10/13/09 to 10/14/09 that was filled in subsequent days before another larger move higher. I will watch for a dramatic pullback to wash out traders before a larger move higher, possibly caused from oil spike.

Also, GOL announced its upcoming earnings schedule. Earnings will be released May 10th after trading hours. This scheduling may increase correlation to the duration period analysis done for the first week of May as expectations are positive.
All prior posts on GOL, or any stock mentioned, can be found by selecting the meta tag link at the top of each respective post. GOL.
Pingback: StockSignalTrader: Elliott Wave and MACD Technical Analysis For Traders » Update To Elliott Wave Count For GOL Analysis()