
The target price of 13.25 was met today based on the break of a B wave triangle outlined in the last post and the prior chart markup below on May 6, 2011.

An update to this prior markup below shows the actual triangle and breakdown of that chart formation. This price motion was outlined prior in the price projections chart.
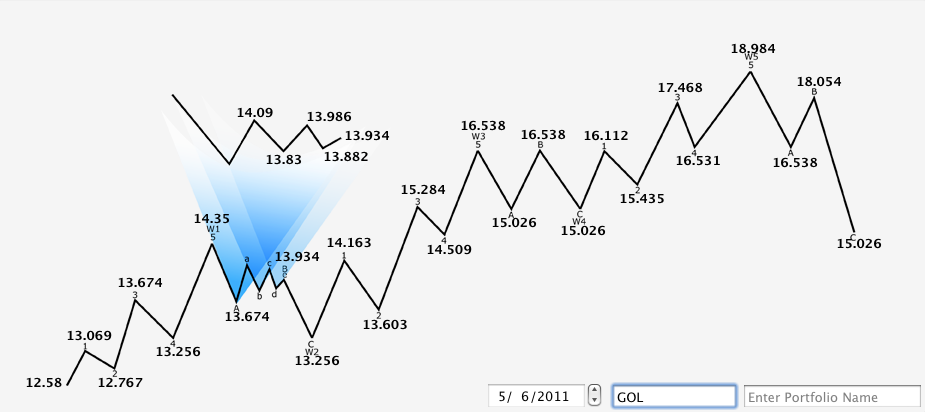

On the 5 minute time frame shown in the new chart above the divergence from the May 3 MACD low was lost in making this new C wave low but after our update to prior analysis that the B wave had not yet formed, this MACD low becomes less important as divergence will only be seen in the C wave of a correction between waves 3 and 5.
We can see at the smallest time frames that a divergence of price to the lowest low of MACD was made in forming the low of the day, although these MACD levels were not tested significantly at all time frames and it may be necessary to create a lower low before a new trend is made.
This means that todays flush out could be wave 3 of C at larger time frames, wave 5 will create a new low and greater divergence in theory.
The divergence shown above at 5 min time frame may only be of wave 3 to these larger time frames.
The correlation to the projected low and the price motion is encouraging however.
All prior posts on GOL, or any stock mentioned, can be found by selecting the meta tag link at the top of each respective post. GOL.