GOLD Triangle Wave B Price Projections

In the previous post we outlined the price history of the GOLD chart (Rangold Resources). Visit that post for the larger picture and possibilities.

This is a recap of the present price motion and expectations. No position in GOLD.

A triangle correction was expected within the larger time frames analysis.

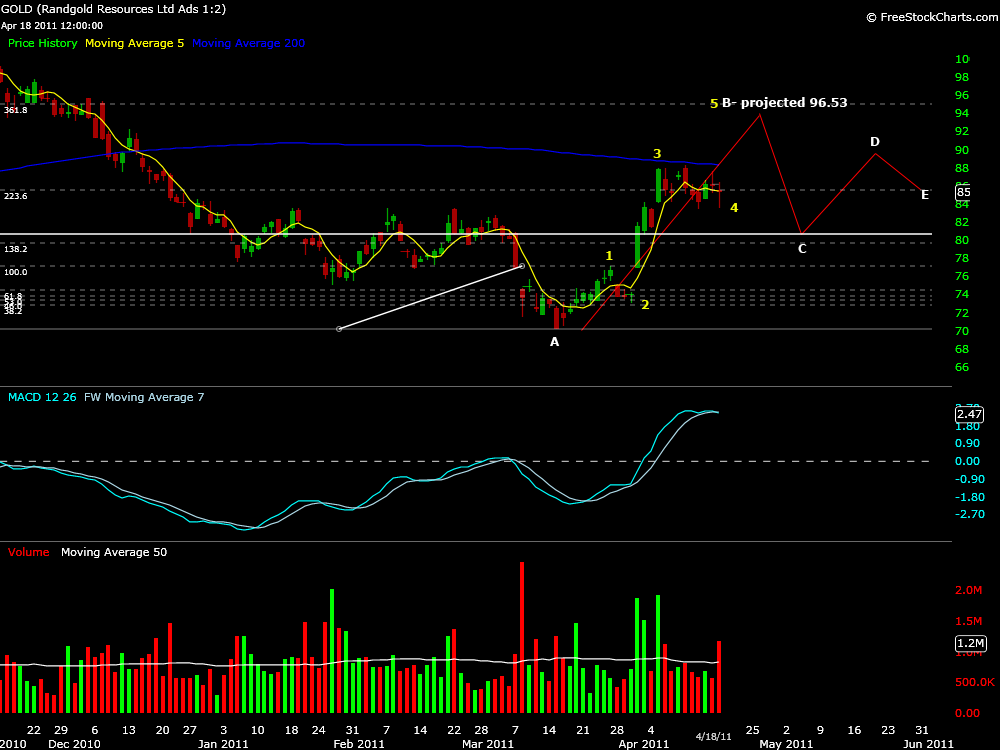
The prior flat or flagging consolidation on the daily chart 4/5/11 – 4/27/11 was expected to break to the 96$ B wave price target.

This anticipated move is shown in the chart below from the previous post.

gold_04_18_11_daily_Bwave.png

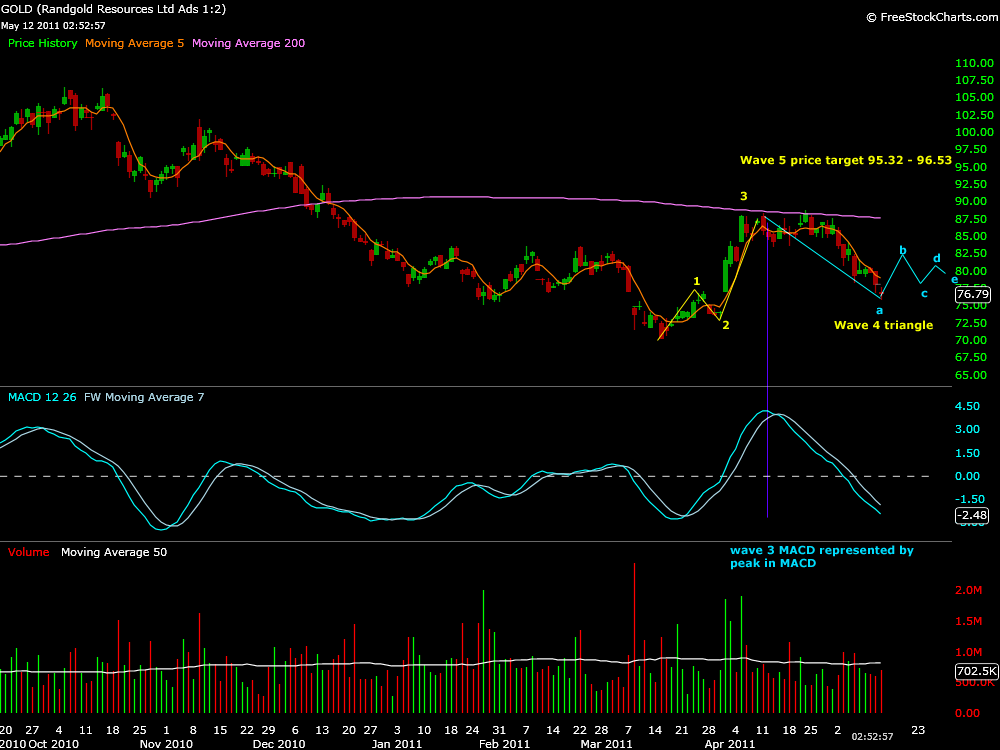
GOLD did not break higher and has since pulled back. However, what has formed to this point is a fairly obvious 5 wave pattern which still projects the B waves target.

The chart below shows the B waves price motion and now incorporates a wave 4 triangle correction within the 5 waves of B.

gold_051211_elliott_wave_trianglewaveB.png

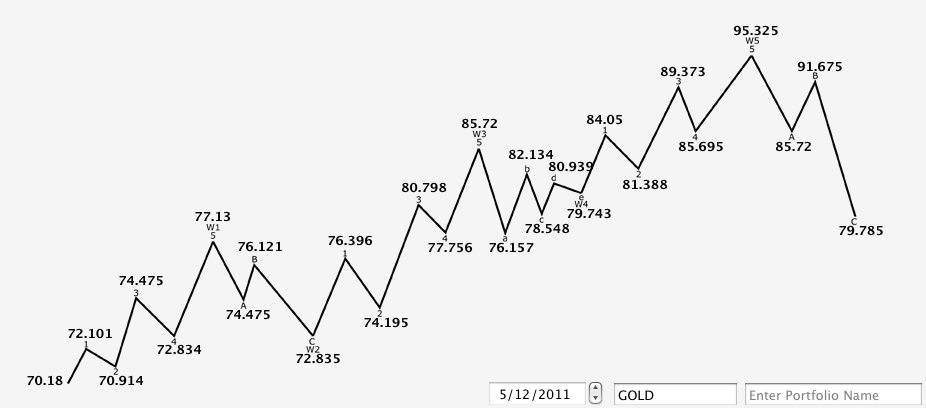
If we use the 70.18 low and the actual wave 1 high to create a calculations chart, the below chart shows possible price motion targets to the wave 5 B wave target incorporating this internal triangle wave 4.

These projections would be negated with trading below the wave 2 projection.

gold_051211_elliott_wave_trianglewaveB_calculations.png

Tagged on:
  • $GOLD continues to play out with the triangle formation projections.

    Previously May 31, 2011 GOLD hit the 82.13 price target for the B wave.

    Today GOLD passed through the C wave target reaching a low of 76.43.

    Triangle formation will continue to be in play from a price projections standpoint if the actual A wave low of 74.53 on 5/17/11 is held. 

    Expectations are for GOLD to rebound to 81$ in a tight range for D and E waves before making a sharp move.

    Expectations are for this break to be higher if the wave count is not complete.

    No current position.

  • Looking at the chart above with the triangle wave 4 price motion laid out we can see that the A wave of this triangle was thought to be established.

    In fact, the price motion of the triangle was following projections possibly completing the C wave this week.

    Todays trading in GOLD was extreme and certainly didn’t follow the triangle projections.

    The gap down clearly broke the triangle trend lines drawn and jumped below the A wave price of 74.53. This breakdown is shown in the attached chart below.

    If this is to be a correction of a wave 3, then a triangle may still form from this low of 73.10 as a wave 4 will not be a simple correction and wave 2 low was not breached.

    The expected wave count diagramed in the chart above did hold the wave 2 low, to the penny. 

    This is necessary for the wave count to be considered an uptrend since wave 2 is the confirmation that wave 1 magnitude can be used for 5 wave projections.

    If this low holds it appears that this move could have been a shake out of traders playing the perceived triangle.

    If this low is taken out then this wave count will be invalid.

    No position in GOLD. 

    6/16/11

  • Update to the GOLD chart shows that after holding a key wave 2 low, GOLD tested the prior triangle support line and failed trading sideways most of 6/17 and 6/20/2011 below this prior support.

    GOLD did not retest the important 63.10 level described in the previous update despite trading below prior support. 

    Today GOLD gapped higher above prior support. 

    Expectations for GOLD remain bullish above 63.10 as this would continue to support the initial  Elliott Wave count.

    Expectations through the end of the month may be that GOLD continues to form within the triangle support resistance lines.

    The chart below shows the price motion of the triangle support and resistance, daily time frame.

    6/21/11
    No position in GOLD.

  • Today GOLD broke out of the triangle formation we had drawn in the previous comment last week.

    Two scenario now exist. 

    The first defines the triangle as complete and an expected wave 2 of 5 correction to arrive next. 

    The second defines the triangle from the extremes of price motion and displays that more time in the scrub is necessary before a break in either direction.

    Both these scenario are diagramed in charts below.

    In either case, GOLD should find support at 78.50 (expected wave C level of incomplete triangle) or the 80 level (wave E or beginning of wave 5 price zero point) if the analysis for a wave 5 continues to develop.

    In addition to the second scenario if the triangle is in its C wave, it must maintain wave A low of 73.10 for the wave count to remain valid.

    Reference the price projections chart in the above post for expected price motion.

    6/29/11 
    No position.

  • Today GOLD made a sharp spike higher in MACD and price. 

    This price action could represent the internal wave 3 of internal wave 3 of 5 shown in the price projections chart above.

    The daily chart below confirms the prior comments made 6/29/11 and scenario one.

    The chart below shows GOLD out of its triangle correction, the wave 2 of 5 corrective phase and the current internal wave 3 move.

    MACD viewed at the 30 min time frame confirms that a wave 3, to a degree, is underway.

    Expectations are for gold to continue to reach its wave 3 target of 89.373 and hold the wave 2 low- roughly 82 actual, 81.38 projected.

    No position in GOLD.

    7/13/11

  • Earlier today GOLD reached the 89.373 target that was expected in last nights comments below. 

    This appears to have completed the internal wave 3 of 5, and confirmed yesterdays peak as internal wave 3 of 3 of 5.

    A chart below shows the mark up of the past 5 days at the 15 min time frame and captures the divergence of the MACD between the past two days price peaks in confluence with the price projections target.

    Expectations are for a wave 4 to form.

    7/14/11

  • Today GOLD reached the Wave B target price based off the prior posts analysis, as well as for this posts analysis for the 5 waves within the B wave itself.

    The below diagram is marked with the elliott wave sequence expected for the B wave and that this wave may be complete, keeping in mind that further bullish action is expected in GOLD if it remains above the A wave low.

    A triangle may form now within the larger wave sequence parameters from the prior post before continuing on to form wave 5 if the current wave sequence is valid.