I really don’t wish to write about PPDI again. It has frustrated me in the past and my negligence to close out a winner into earnings just because a price target had not been met has cost me.
However, as I have searched and studied the charts of my losses and winners I have come across two new forms of technical study that I believe I will continue to try and perfect as I have the Elliott Wave. At the very least they may help me get into and exit trades in a more timely matter.
I am by no means experienced at either of these new forms of analysis and have just begun to utilize what they may offer-a more simplistic view.
First, the 5 day moving average which I wont speak of specifically in this post but I have begun adding this to my check list. It is extensively covered by @alphatrends who is an expert and has written a book covering this. I have not yet read his book.
Second, the Alan Andrews Pitchfork. This technical analysis tool is also very new to me. I have just begun to investigate it over the past few weeks and it was brought to my attention via @fibline who uses this analysis as part of his K.I.S.S methodology.
Thank you to both as I learn these new techniques and how they may help in my future trades. Both these traders can be found on StockTwits.
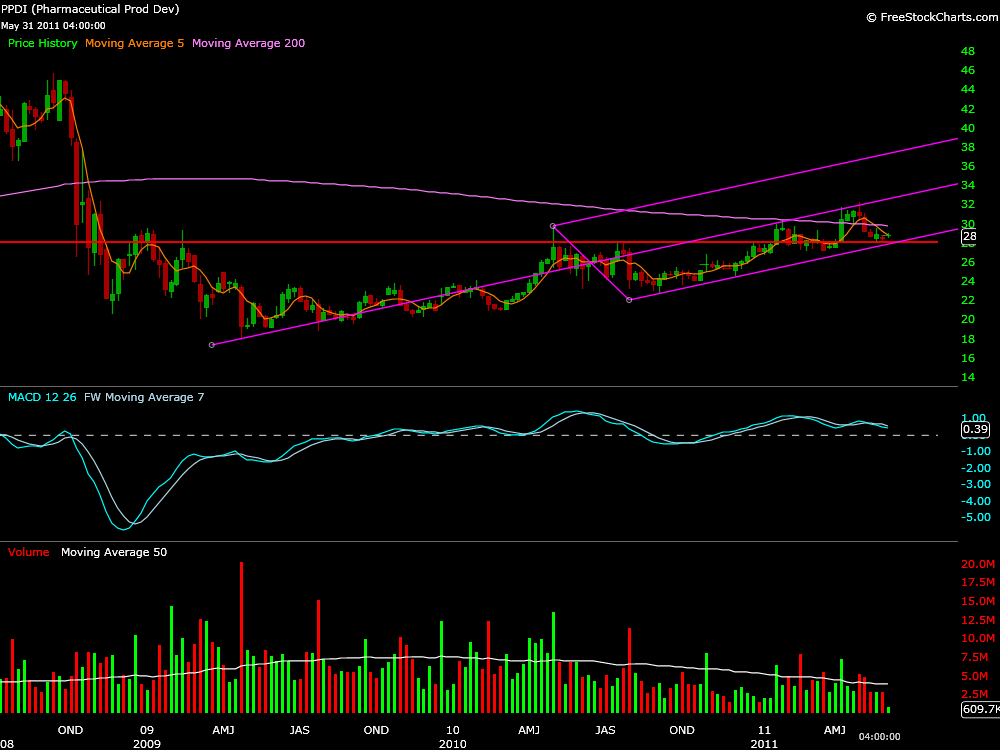
I’m looking at PPDI again because its longer weekly time frame still had my attention. It had a very large weekly cup and handle pattern which originally I thought would be supported at higher levels.
Even after trading like a dog after earnings, since the stock hit 28.05 5/18/11 it has been making marginal higher lows in a very tight range fighting with its 5 day moving average. Just looking awful but slowly moving from lower left to upper right.
I found myself looking at a lot of trend lines, support lines, resistance lines, long term, short term. It all seemed very random, or at least not quite resilient enough a strategy for the types of price moves I’m looking for. Furthermore, the 5dma was resistance the whole way down.
The Andrews Pitchfork- my understanding so far has this concept outlining a trend with combined pivot points as well as buy and sell trigger points. This has so far exemplified the same types of methodology that I find useful in Elliott Waves, but it removed the subjectivity of the wave count. A bonus.
And Fibline explained this point briefly to me as such; anyone can draw a pitchfork the resolution of an Elliott Wave is much more complex/subjective.
I do believe this simplicity to be a advantageous, but also mention that this characteristic in itself should not be bought into any more so than the failure/success of a complex theory.
All technical analysis is subject to price no matter how simple or complex. Nothing but price should be explanation for profits and losses.
The chart below shows an Andrews Pitchfork drawn in pink at the weekly time frame. The red horizontal trendline shows what is possibly a cup and handle support area.
Currently PPDI has bounced at a point near to the convergence of the lower parallel line and this longer term cup and handle support line.
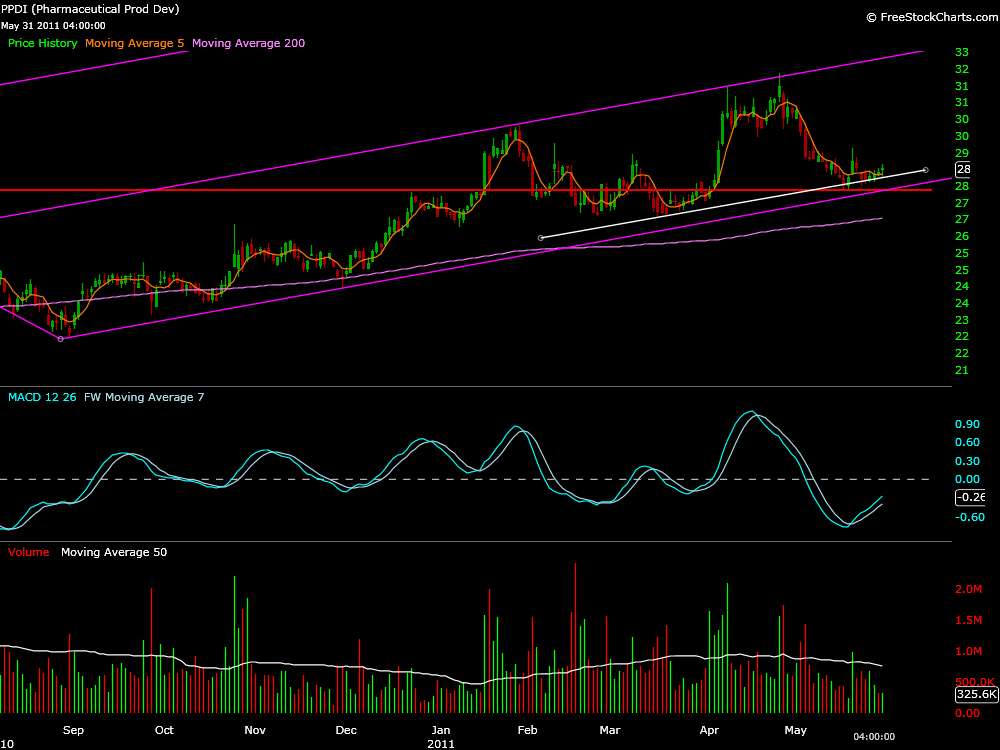
Next a daily chart shows that there has been strength at a parallel line within lower parallel support on two occasions in which PPDI did not trade to the lower parallel support and still reached the median line creating higher high and higher lows.
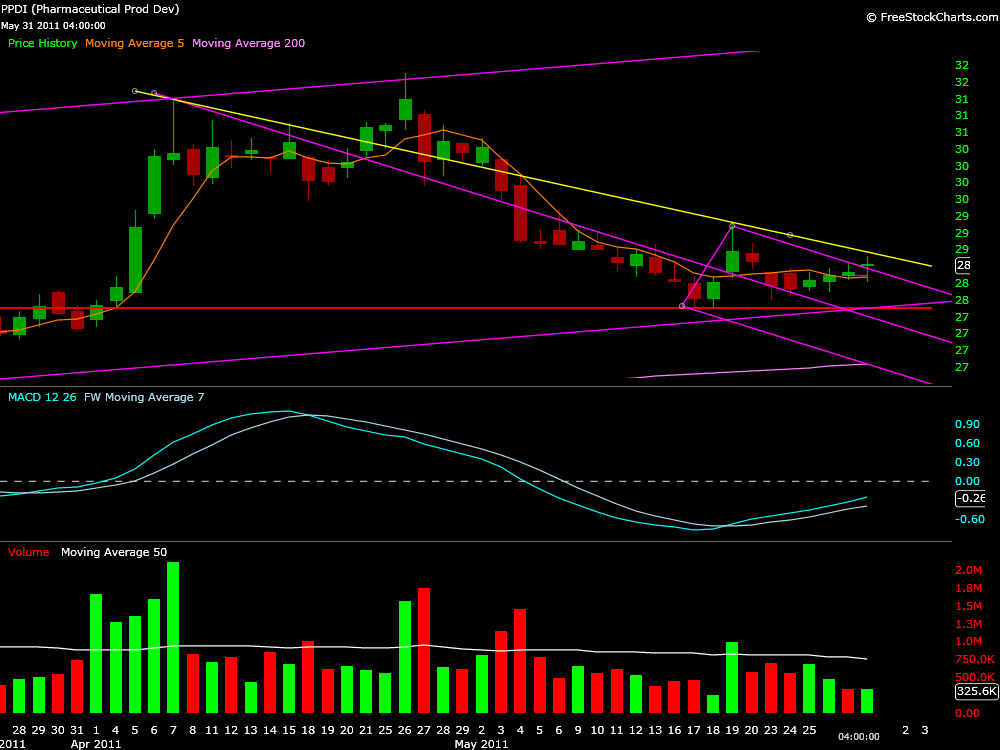
Andrews Pitchfork drawn again at the daily time frame from the recent top, low and pop as ABC points. The upper parallel line in this chart has been breached in todays trading. This is a sign that a buy signal may occur. The yellow line is the buy signal trigger line. It was tested today using the daily timeframe.
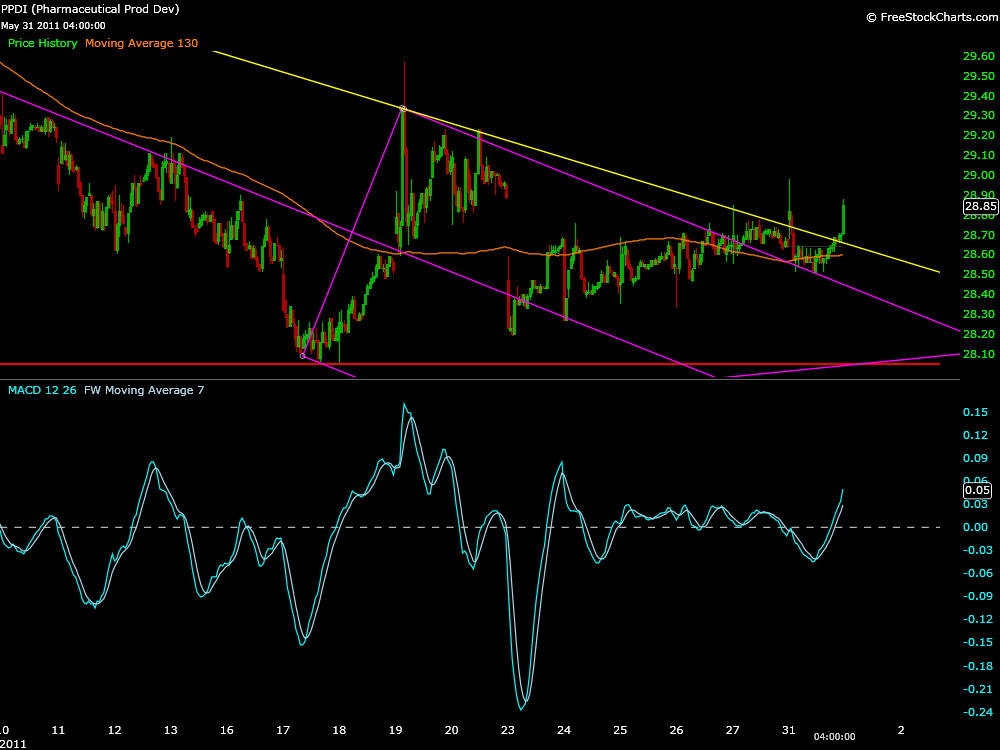
The last chart shows a 15 min. time frame chart in which the C point of the Andrews pitchfork from the daily chart above is repositioned to exclude the extremity of the trading on that day.
Not only does this seem to create a better picture of the resistance on subsequent days but it also gives some credit to the possible importance of todays trading.
Today after a break of the trigger line (yellow) the selloff was met with support at the upper parallel line and a close above this trigger line and the 5dma was the result.
As well, it can be noted that about 400K shares have traded since the close- almost half the daily volume.
These are some of the things that I have noted while watching PPDI today.
Although this outline of PPDI seems bullish, I’ve been wrong in the past about this one and am not even close to finished reading up on the Andrews Pitchfork or the 5dma techniques to know if this is accurate.
Price is truth.


