
I’ve been writing about HL lately and have a trade on to date in the name. The updates on this trade can be found here.
Even though things are so far working as planned I looked at the GDXJ today to see if the sideways price motion could be explained by a broader sell down in the miners or just in HL.
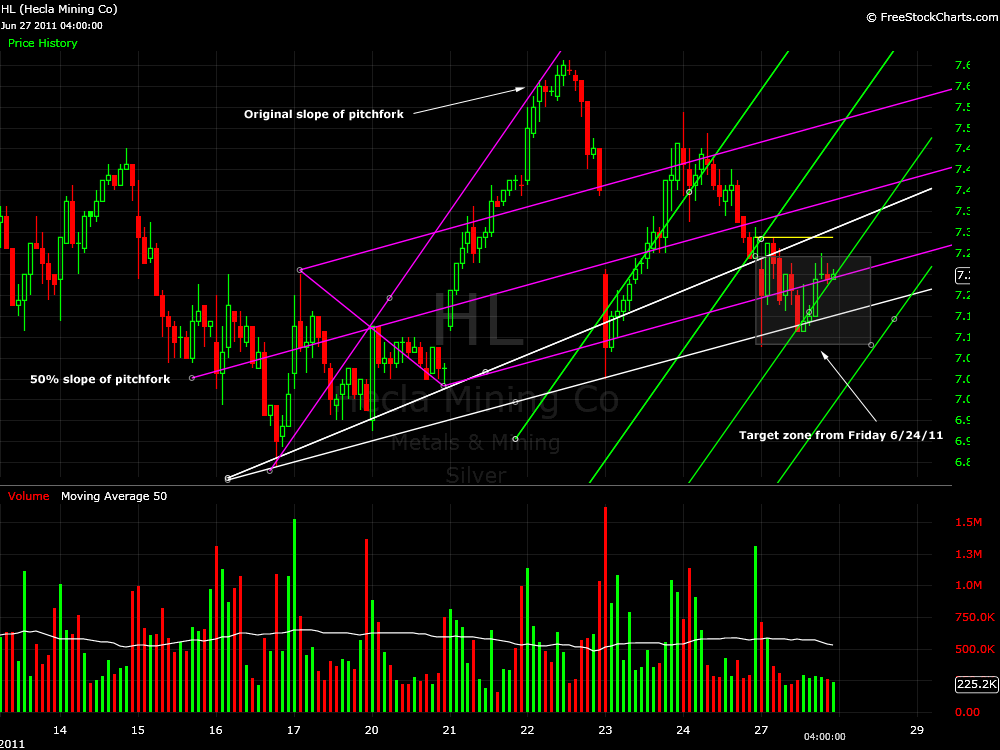
The GDXJ was getting sold off through some support in the morning and mid afternoon. But just as HL reached its warning line (chart) and rebounded so did the GDXJ.
This got me to look at GDXJ within the same parameters I had been looking at HL. One of these parameters being the use of the Andrews Pitchfork.
This method is still new to me but has been providing excellent readability in the intermediate time frames during sideways price motion- or the chop.
I ran a couple of these indicators on the GDXJ and came up with an interesting theory, but one that is well known.
From failed moves come fast moves.
Now saying this doesn’t imply that this is in the bag, but in my mind this scenario needs to be the case for the GDXJ to pull higher.
Both charts below are at the daily time frame.
The first chart shows the pitchfork drawn at points ABC. Traditional points of contact, high low high.
Further, the screened box represents a pivot zone. A pivot zone can be estimated by measuring the distance between points B and C.
Duplicating this distance from point C sets a zone of time in which the price should reach the median line of the said pitchfork. We see that GDXJ is just exiting this zone.
Nothing is ever quite precise. The touch of the median could come tomorrow/this week. The expected lows and the median line are much lower according to this chart.
Yet, this is the first instance of from a failed move comes a fast move.
So far, GDXJ has failed to reach its median line within the pivot zone. As well price has not accelerated lower past the break of support at pivot B in the past week.

The second chart is very similar to the first. But I again looked at GDXJ recent price history with the concept of from a failed move comes a fast move in mind.
The concept implies that failed moves are incorrect indicators of future price motion. What if pivot peak A from 12/7/10 on the last chart was a failed move?
It certainly appears that way and a fast move resulted to the pivot B low.
In the second chart I moved the pivot A to the prior peak and not the highest high in the first chart as to not represent the failed move in the reaction of future prices.
The pitchfork now has a slightly different slope. Now look at the median line relative to present day pricing and relative to the shaded pivot zone which has not changed.
Price is right on target for a swing trade.

Reading Median line pivot rule 3 verbatim from “The Best Trendline Methods of Alan Andrews and Five New Trendline Techniques” by Patrick Mikula:
“When the price reaches the Median Line in the Median Line Pivot zone, it will often end up touching the Median Line more than once before forming a pivot. This means a trader watches for a pivot but does not blindly enter the market expecting an immediate swing reversal.”
As well, failure to reach the upper parallel line after the initial tap of the median line, in theory, results in an expected move to the B wave low.
After the 6/1/11 swing failed to reach the upper parallel, GDXJ found itself where it is today not unexpectedly.
This is simply another way of looking at the market data. Can we interpret failed moves of the past (which are not random viewed in the present) in our analysis of the present with probable success?
If the alternate pivot A theory continues to stick, and GDXJ holds this low, then from a failed move lower will come a fast move higher in GDXJ.