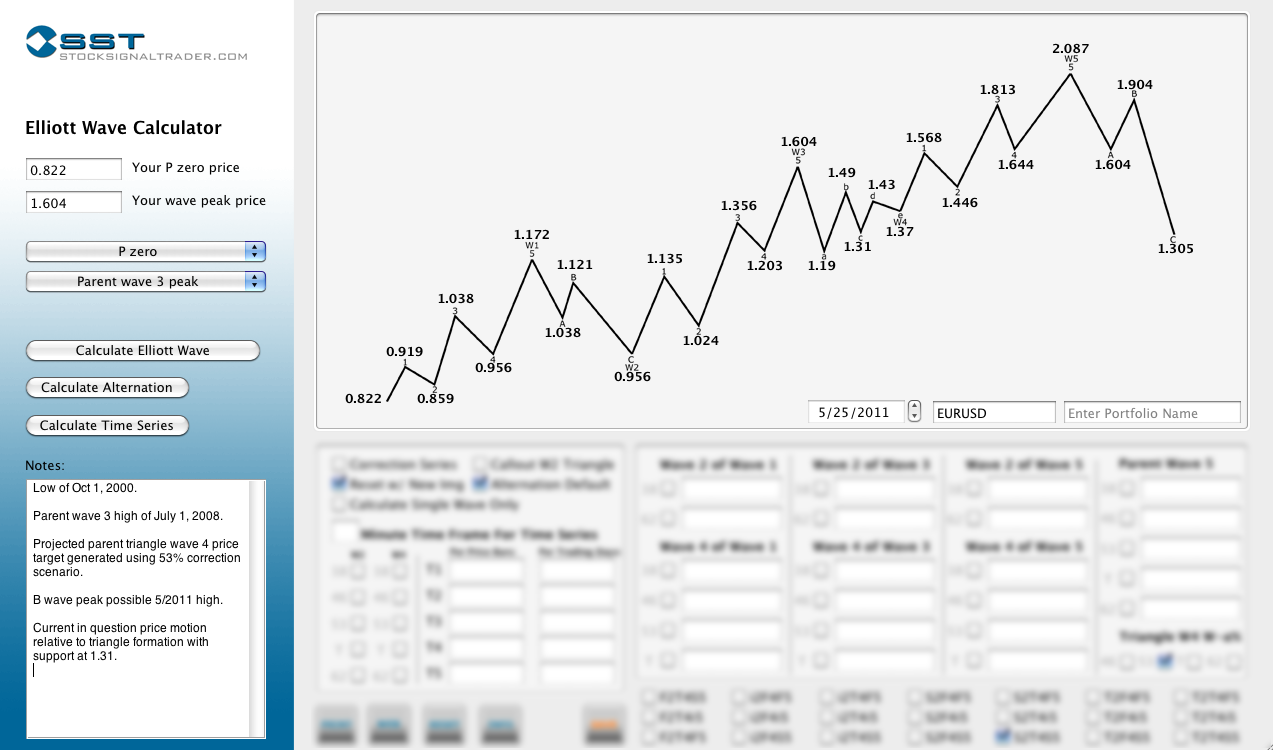
EURUSD Monthly Triangle Elliott Wave

So far the EURUSD Elliott Wave analysis done in late May provided a fairly accurate road map for price action.

In mid July we noted that the 1.3838 level may be significant within the shorter term time frames move as the EURUSD was showing initial support at this level.

Breaking this low was noted possible and the 1.31 monthly time frame level could then be anticipated.

Price in the EURUSD reached 1.31 quite accurately (1.3147) and rebounded to a high of 1.4246. The monthly triangle target price for the D was 1.43.

It is important to remember that according to this particular EURUSD Elliott Wave count price is NOT trending currently. And a triangles price motion is very volatile and capable of testing or creating new marginal lows and highs within its points.

Many times a charts picture does not become worth a thousand words. Even though these projections could have been worth much more if acted on, I don’t anticipate this continuing to be the case.

In my opinion the triangle could be the most deceptive of “morphing” chart patterns.

eur_usd_052511_monthly_elliott_wave_calculations.png

1.37 is the E wave of the triangles target price. This is where we find the EURUSD this morning and likely where resolution to the Euro crisis continues to surface or dissolve. The chart will morph or build between this point and its C wave low of 1.31 according to the projections.

As a final note Elliott Waves work until they don’t work, not dissimilar to the execution of much simpler trading strategies, however they are more accurate when trend has been established and not in a corrective phase as believed here.

For example, if we are correcting from a parent wave 3 this waves structure was dependent on a test of wave 1 internal or a successful wave 2 internal low. In this sense any corrective parent wave 4 (triangle or simple) that holds wave 2 internal of parent 3 would not negate the uptrend picture even though it falls outside of the anticipated corrective patterns.

The triangle is a projected corrective chart formation not rigidly inclusive of calculating wave count. All trending wave structure is based off wave 1 relative to time frame.

Reference this prior post for documentation of the Elliott Wave charted in May for EURUSD.

As usual time will tell if these formations continue to hold up. I have no position in the EURUSD today.

Tagged on:
  • With todays strength in the markets, up over 3.5%, the EURUSD is also again showing strength. 

    Many are now beginning to realize that nothing is off the table when it comes to intervention.

    The EURUSD market is now leaning towards finding continued resolutions to the EUR problem through time rather than the more immediate chaotic considerations that have brought us to this point. At least thats what todays price action reversal seems to think. 

    The EURUSD tested the important 1.31 level on 11/24/11 reaching 1.3213. It is now trading around 1.35.

    Based on the price action since the 1.31 low, the Elliott Wave count for a monthly triangle to break higher and EURUSD to trend higher is still intact. 

    Daily price chart below: eurusd_113011_daily_131_retest.png

  • “Many times a charts picture does not become worth a thousand words. Even though these projections could have been worth much more if acted on, I don’t anticipate this continuing to be the case.

    In my opinion the triangle could be the most deceptive of “morphing” chart patterns.”

    These comments from the post above are fitting today. 12/13/11. 

    Today EURUSD broke the 1.31 support level thought to be a resolved wave C of parent wave 4 triangle low. Reference the chart above for this wave count.

    As EURUSD broke this low, the resolution of the C wave (and to an extent the wave count of parent 4) is now in question.

    Anticipating price action within a triangle formation is not far from Russian Roulette. 

    The 1.19 projected low will now need to hold. Reference the prior post (link above) for more on the 1.19 level. I do not anticipate this low being tested significantly if the prior trend is to resolve higher. 

    Right now there is NO trend however. The triangle has not resolved itself and “Elliott Waves work until they don’t work.”

    My current inference is that EURUSD will reverse before 1.25 is broken or tested. 

    No current position EURUSD.

  • Late November 2011 I updated this post with pessimism and a target of 1.25 after eurusd broke 1.31.

    Today I update the post with skepticism, yet optimism is the most broadly held sentiment of all crisis and all markets currently.

    The eurusd has made a low of 1.262 on Jan 16, 2012. This is fairly close to anticipated levels and does not violate the Elliott Wave.

    More interesting at this point in the down trend however is the Fibonacci levels in action. 

    The chart below shows that support was found at a 127 extension from the May 11′ top. As well recent daily support has been found by closing above an internal fib 127 extension.

    A possible target from this move higher may be 1.344 with current support holding.

    A break of the current low would likely lead to the internal fibs 1.618 extension, which is roughly 1.246.

    01/19/12

    011812_eurusd_fib_confluence.png

  • Today is Sunday February 26, 2012.

    Mid January 2012 we updated this monthly Elliott Wave post with the anticipation that EURUSD could have made a turning point low and the wave count was to remain intact. 
    This low of 1.262 on Jan 16, 2012 can now be interpreted as the Wave C low of Wave 4 triangle shown in the monthly Elliott Wave chart in the above post. 
    Prior, given the Fibonacci confluence (shown in the comment 1/19/12 chart below) we suggested if a turn was in place that price could rebound to the 1.344 area where there was some price congestion.

    This 1.344 level is currently where the EURUSD trades as of Friday February 24, 2012.

    So far the monthly Elliott Wave triangle can not be ruled out. 

    As well, 1.43 is the estimated peak of the D wave and will be the next target resistance in EURUSD if the 1.26 low holds.

    It will be important to note how price reacts to the 1.30-1.31 area going forward, as this was the projected low of Wave C- actual low may now be 1.262. 

    The daily chart below shows how price tested and rejected this area sharply on 2/15/12 after having regained the target low. Significant basing below this level may be warning that the wave count is not sustainable. 

    No position in EURUSD.