Today I found the volume in the DJT to flag further interest in an Elliott Wave count I had briefly explored only a few days prior.
Lately I have been bearish. The thought of a bullish continuation in the markets appears to be far from possible in the current environment, but the DJT has my attention and perhaps holds my only bullish bias on the market right now as crazy as it may be.
I am not a DOW theorist. That said I value the ability of markets to relay a powerful trend off the confirmation of the transports. Combining this confirmation principle with a possible correlating Elliott Wave count could conspire a large tell, or advantageous conviction, in a difficult market environment.
One of the largest caveats to constructing a case for a bullish run in the DJT is time frame. This Elliott Wave count is based off the Quarterly time frame and places its emphasis on trend and not timing. However, with the end of the year coming, the 4th quarter candle will catch immediate attention.
Todays volume reading was the largest Daily volume since 2005. This volume spike comes at a precarious level at the intraday time frame but also possibly resembles price action of 2005.
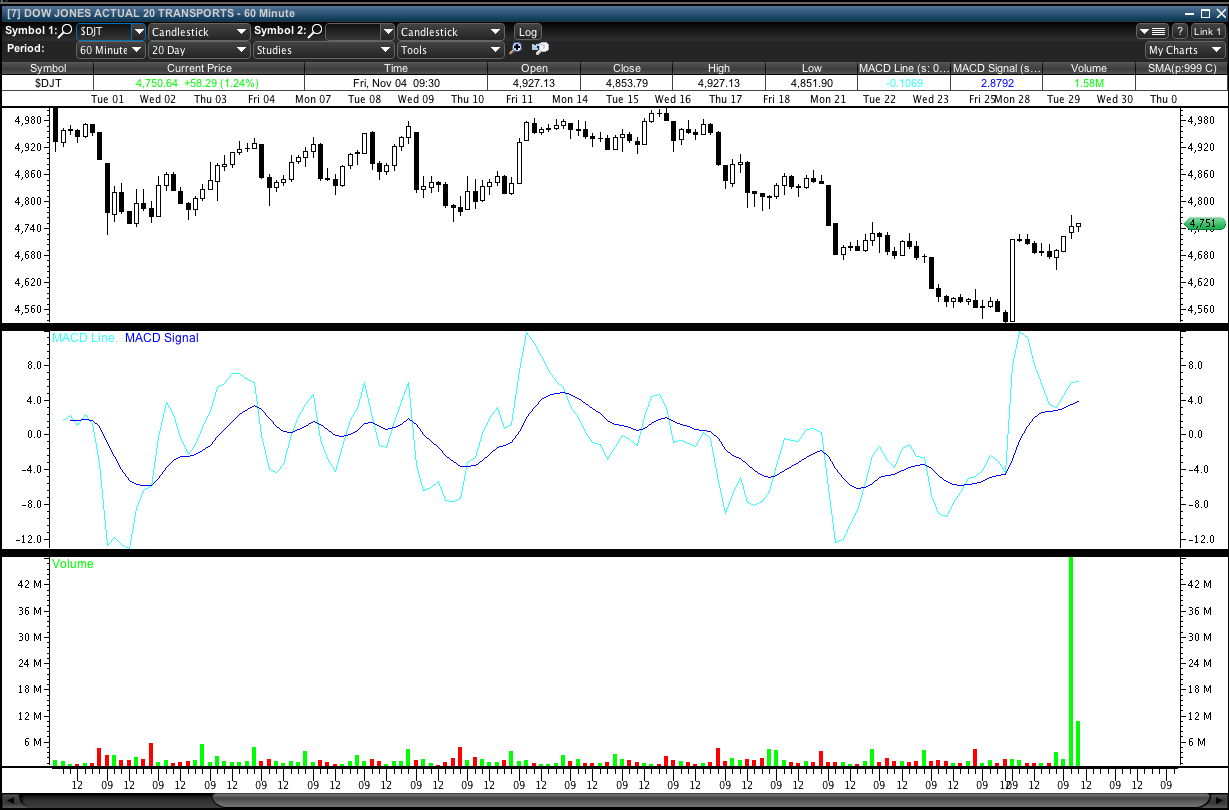
A chart of todays intraday volume on the 60 min time frame.
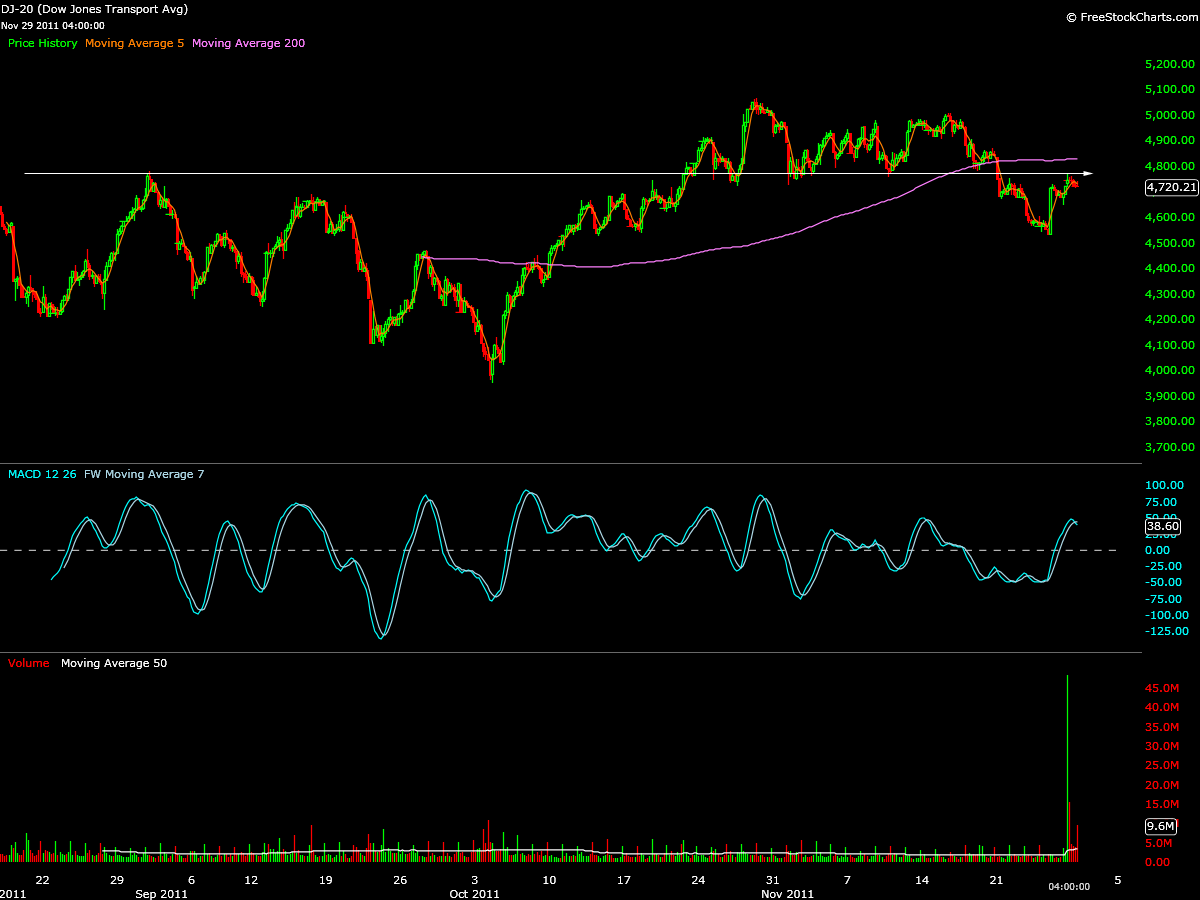
A chart of the hourly support resistance line.
A close up chart of the hourly resistance found today.
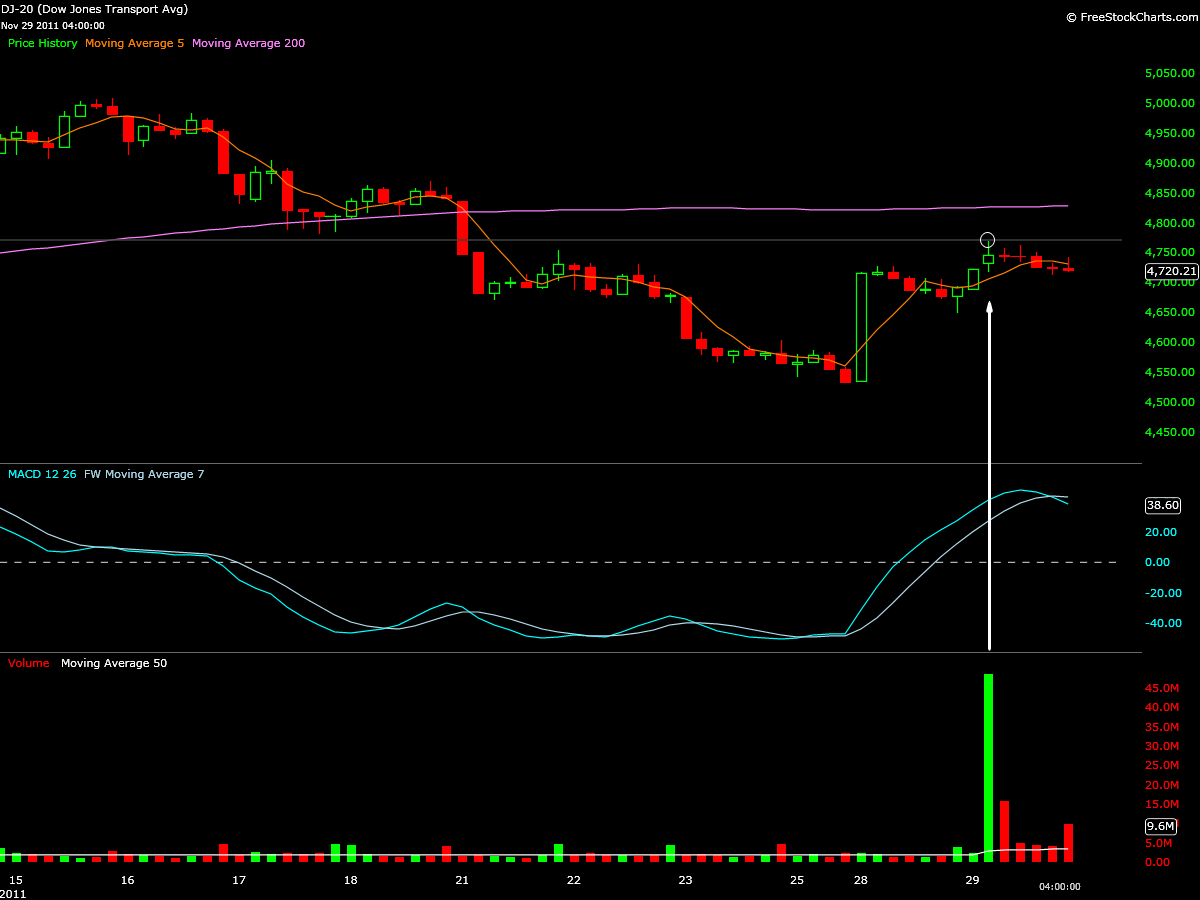
By looking at these prior three charts we see that volume came in at a key support resistance level at the hourly time frame and could be construed as a large seller of prior support.
The hourly charts also show a MACD that is crossing and rolling over. This appears to be bearish although todays trading did outperform other market indices and closed above the widely watched 4700 level. If the DJT does not breach todays 4770 level and hold above this level my target low for a continuation off the high of 10/27/11 is 3676.
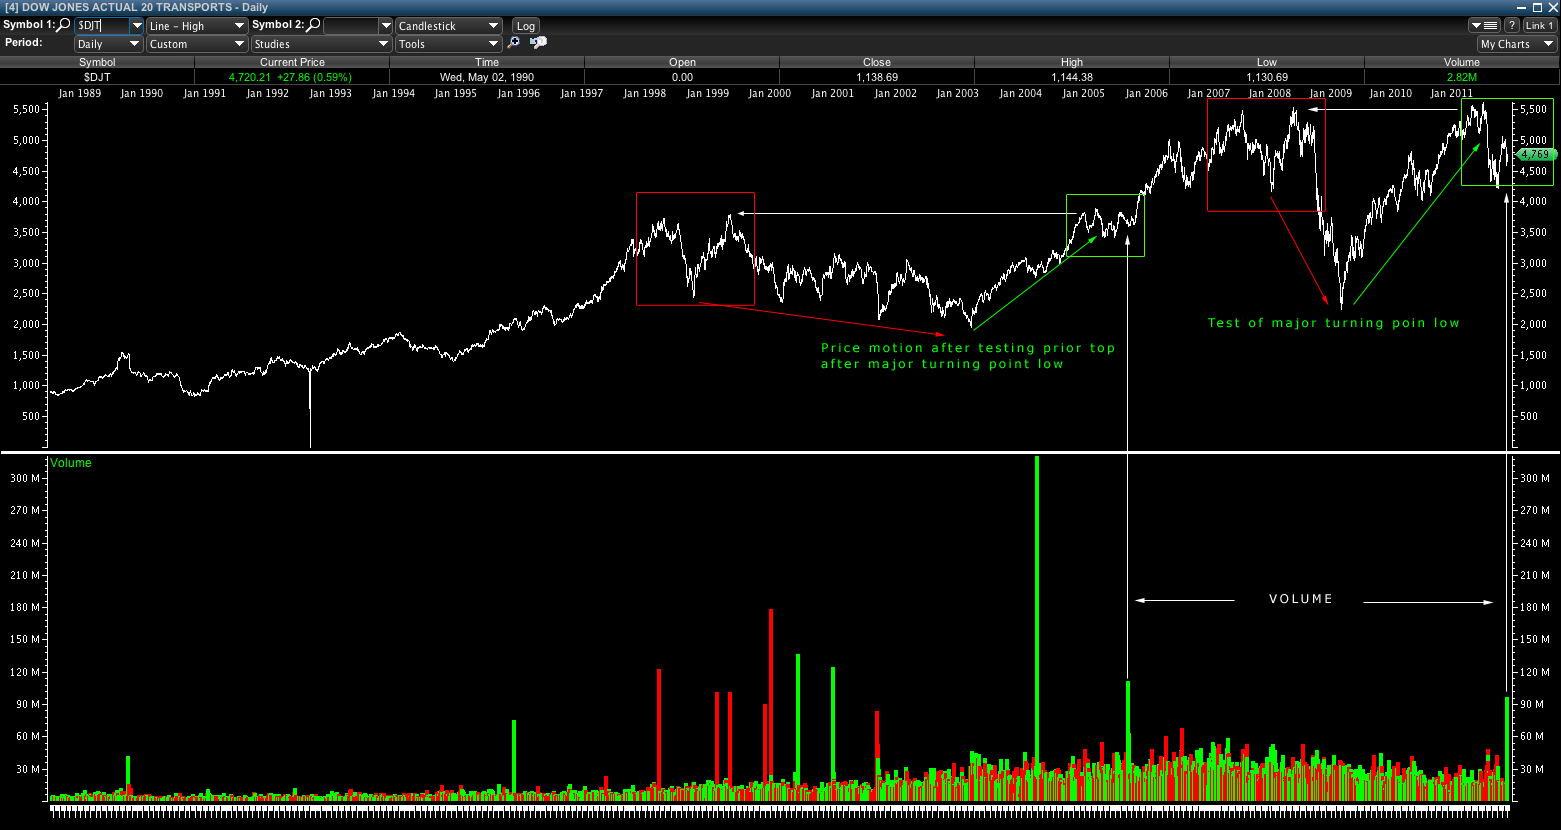
A chart of the daily volume in DJT from 1988.
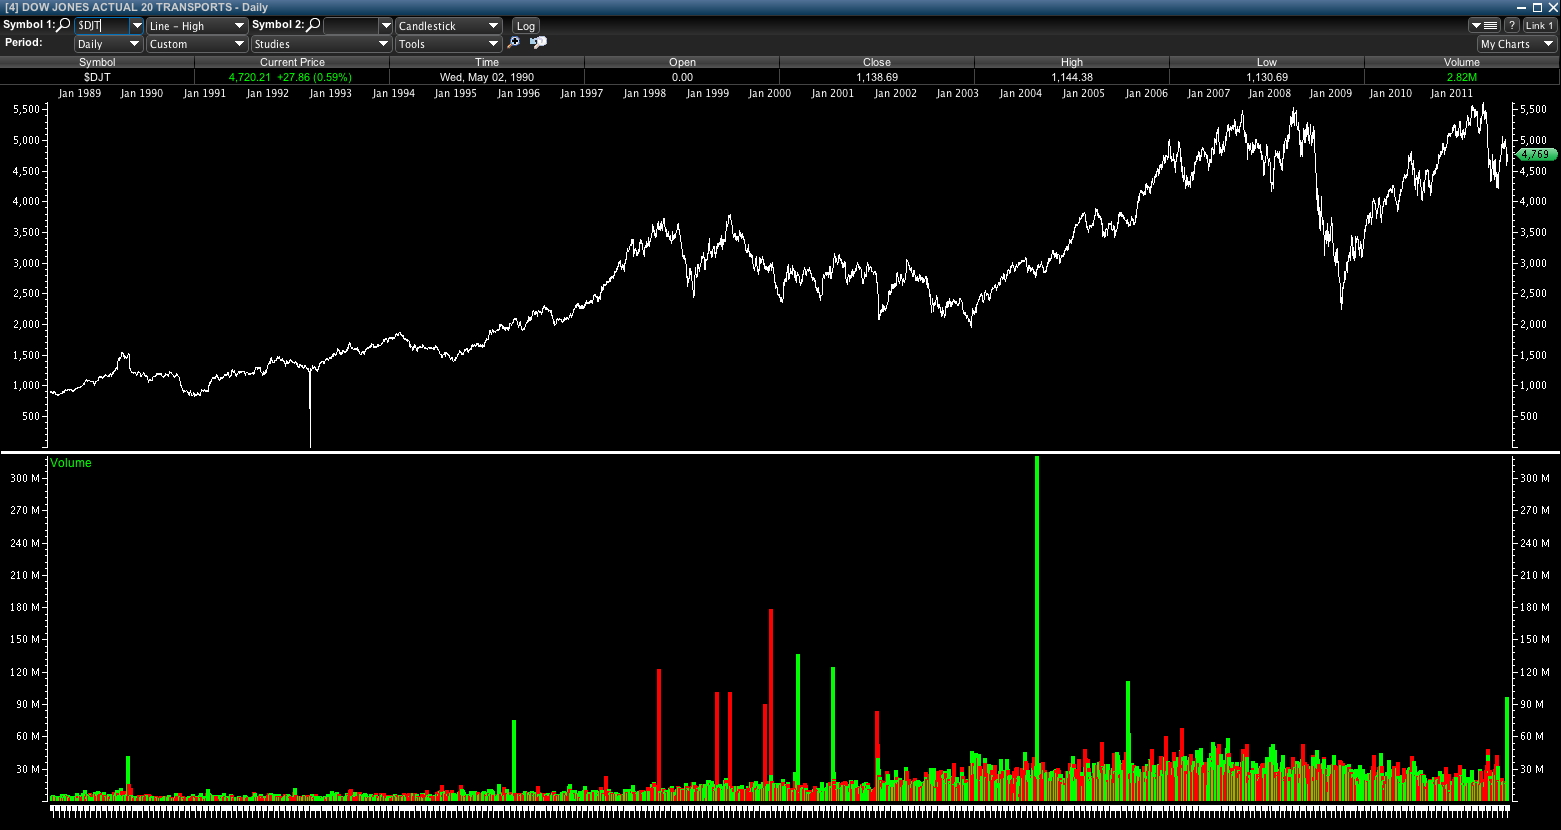
The above chart shows the long term volume pattern of DJT and just how long it has been since the DJT had a daily volume bar this large- it means something.
Time frame being the key, it is difficult to determine when and where this volume will show its hand. Has it done so already at the hourly time frame as resistance volume? Or, can we gather evidence from the price motion at a prior similar volume spike within a larger time frames perspective?
Looking again at the line chart above we notice that the volume spike in fall 2005 comes after a strong run off prior major turning point lows in which the present peak tests prior major turning point highs.
The chart below attempts to extrapolate the price motion of today to that of 2005 to support the bullish Elliott Wave count to follow.
Daily chart from 1988 showing possible price motion similarities relative to major turning points and volume spike.
Below is a close up of the daily chart from 2005 compared to the price motion and volume of present pullback- certainly the volatility is accelerated, but there are some stretch similarities considering volume, test of prior highs after turning point low and seasonality.
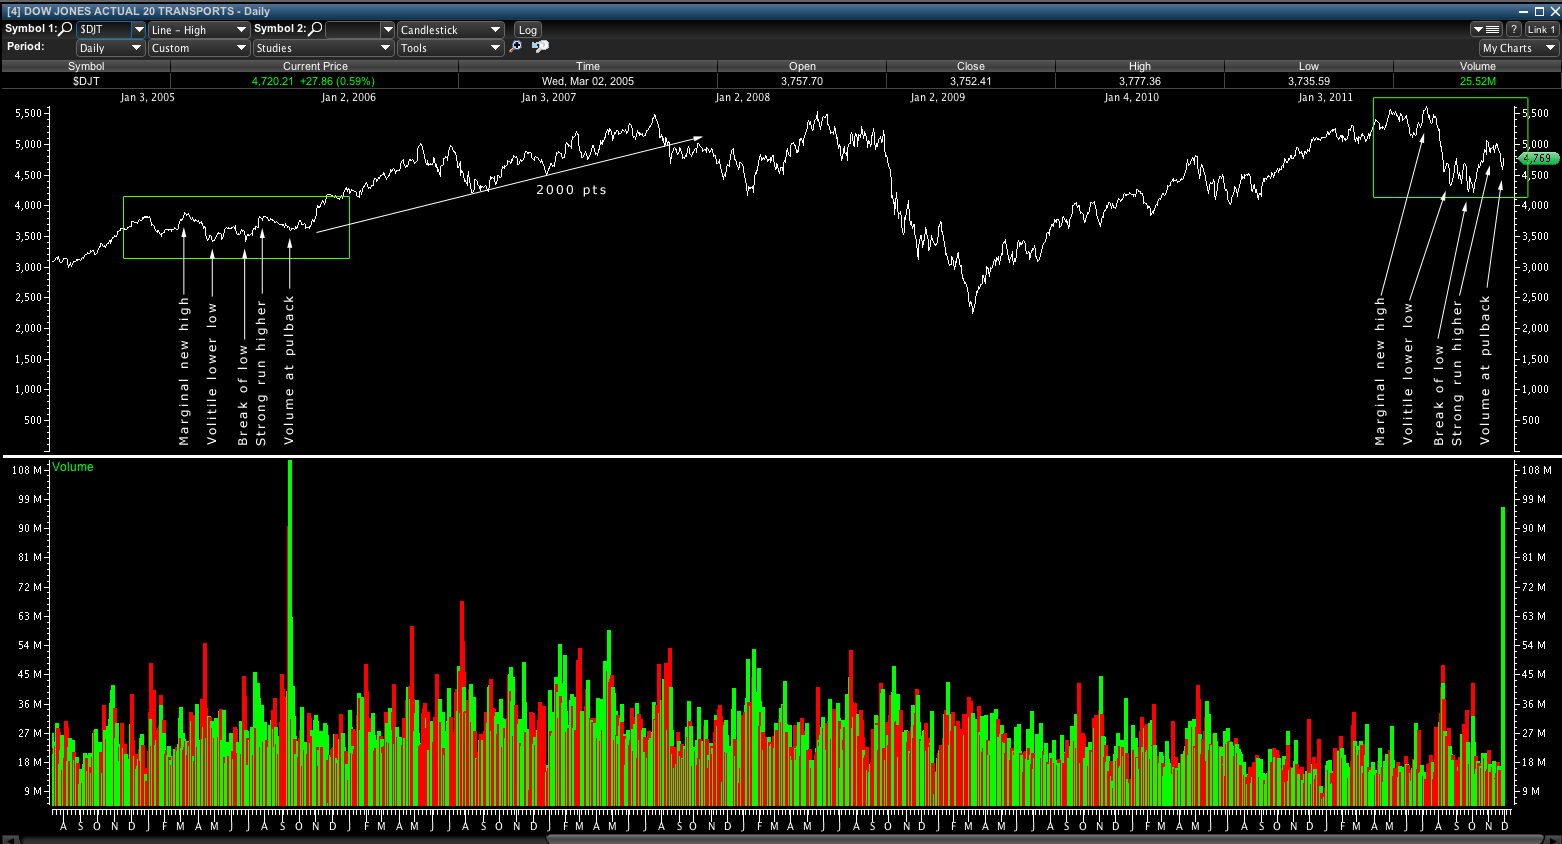
This volume and price motion comparison to 2005 sets the stage for trend to possibly be higher and leads into the Elliott Wave count confirming this bias.
Based on the information gathered so far, if the comparison is to hold a bullish bias, the positive expectation based upon prior price motion would be a target roughly 2000 points higher. Coincidentally, if the bullish trend fades, the prior mentioned downside target of 3676 is roughly 70 points from the 2005 volume spike breakout.
Exciting. Now for the quarterly Elliott Wave count.
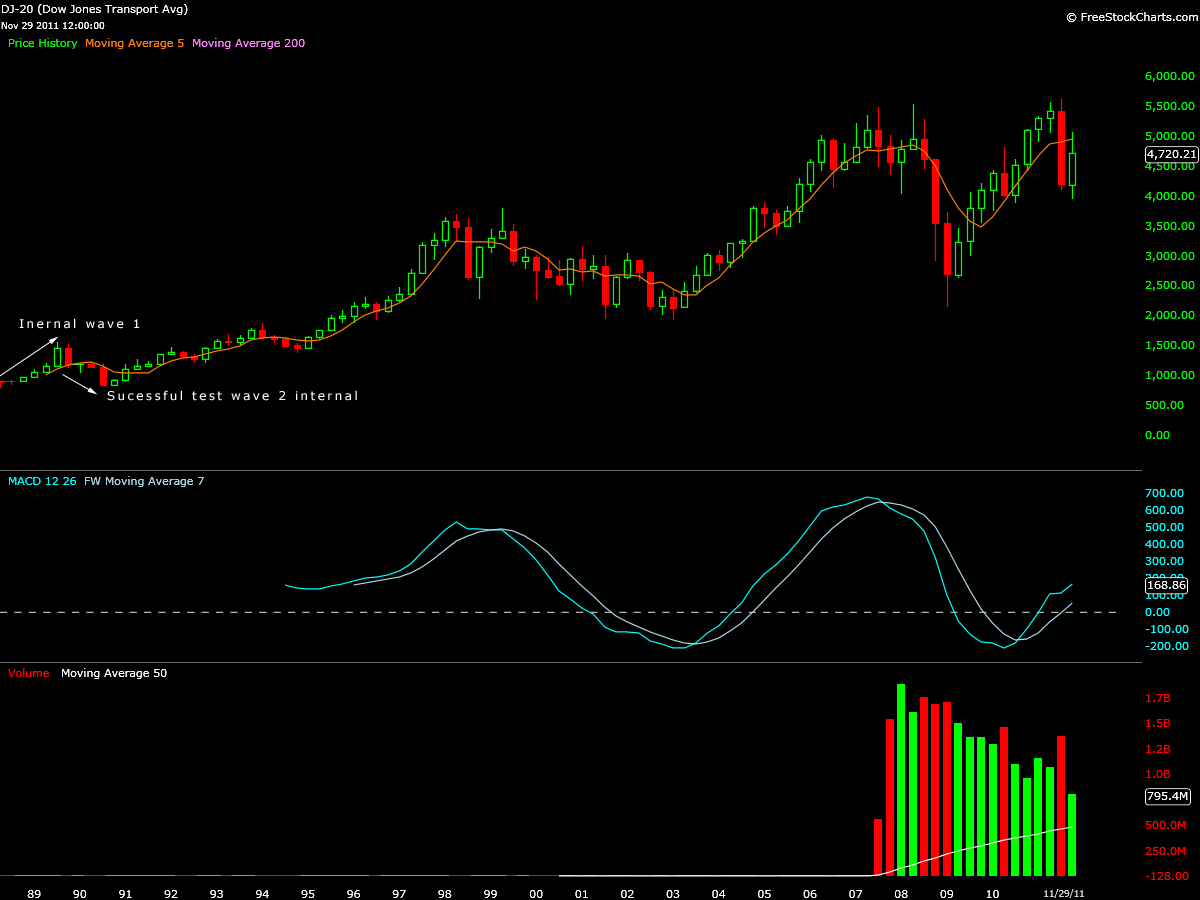
The wave count is based off the 6/30/88 low measured to be 780 based on the freestockcharts.com quarterly charts. The internal wave 1 of the wave count is based off the 9/30/89 high measured to be 1550- numbers are rounded. We can see that a test of this internal wave 1 was successful at the 9/30/90 low which confirms internal wave 1 of Parent 1.
A look at the quarterly chart below shows the internal wave 1 magnitude used for the Elliott Wave count.
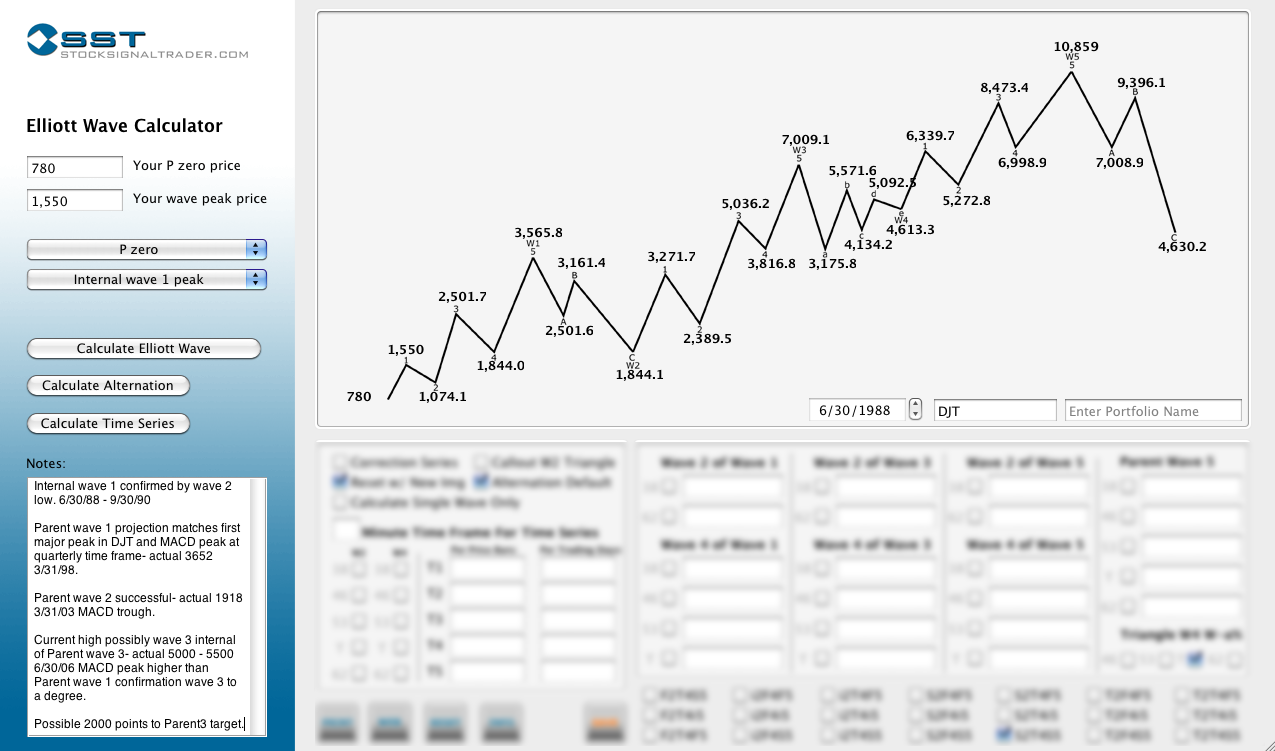
A chart of the quarterly Elliott Wave mathematical calculations based off this internal wave 1 are shown below and suggest that the DJT may not yet have completed its parent wave 3.
The Elliott Wave calculations are confirmed by the quarterly charts prices as well as their relationship to the MACD.
The highest peak in the MACD will always be a wave 3 to a degree. At subsequent lower or higher time frames we will see the divergence of these peaks reach their internal wave 5 targets. The correlation of wave count projections and MACD is paramount to isolating the correct count as well as determining relative time frame.
In this case we determine that Parent wave 1 MACD, shown on the quarterly chart below, is diverging at smaller time frames because our internal wave 1 calculations/projections correlate to the price at this MACD peak as a completed 5 wave sequence.
In addition, we know that wave 3 internal of Parent wave 3 will be the most powerful of all 5 parent waves and this is reflected by the largest peak in MACD, so far, forming at this projected price and time frame.
The chart below shows the quarterly DJT MACD correlation. Internal wave 3 of parent 3 will have the largest momentum.
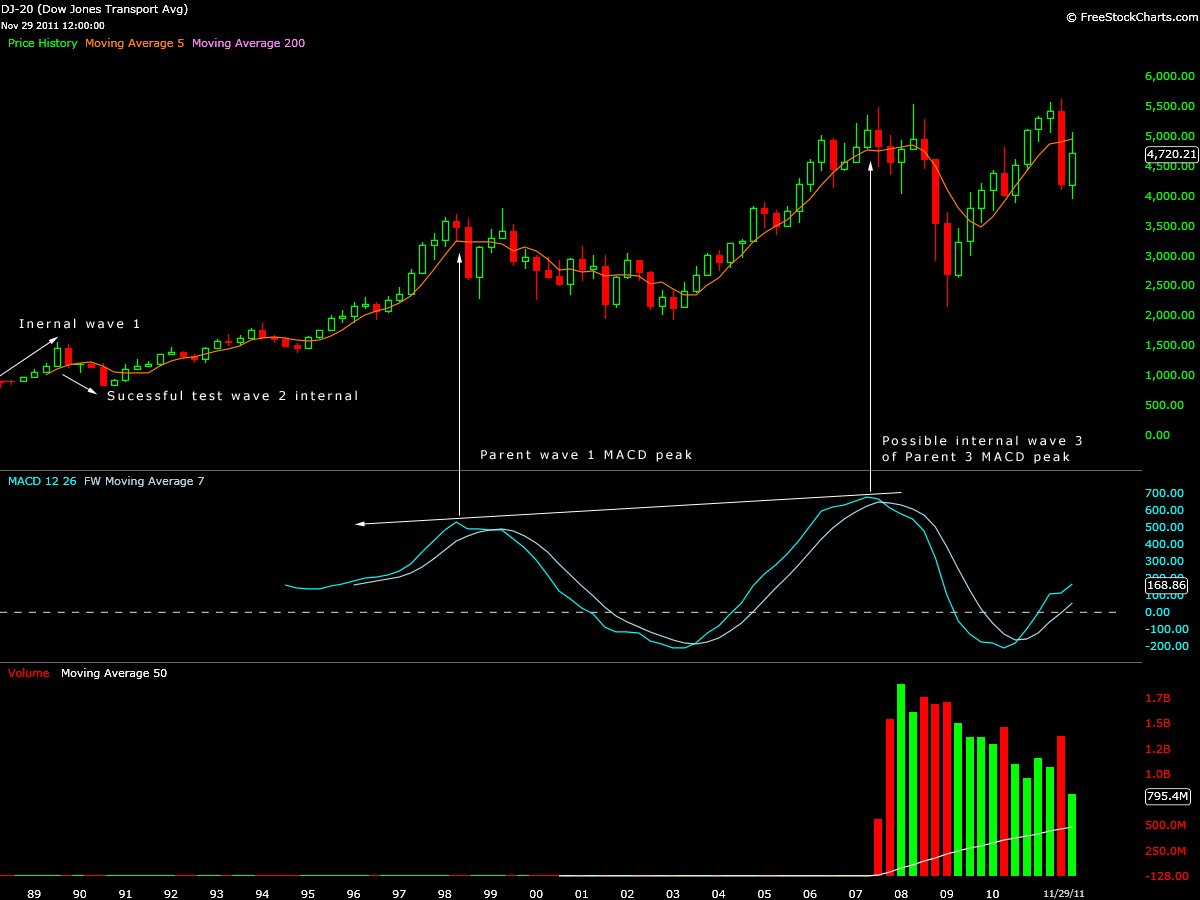
In conclusion, the DJT Elliott Wave projections chart targets parent wave 3 at 7000. This is roughly 2000 points higher from the current highs and correlates to the projected wave count target from an internal wave 1 in 1988 which is confirmed in 90, 98 and 2006. This target also echos the magnitude attained in comparison to the 2005 run off similar volume, price motion and seasonality.
I find myself shaking my head already and reasoning this data as possible “fitting” consolation to covering my shorts last week… but I had to finish this thought.
Time will tell and price will not lie.
