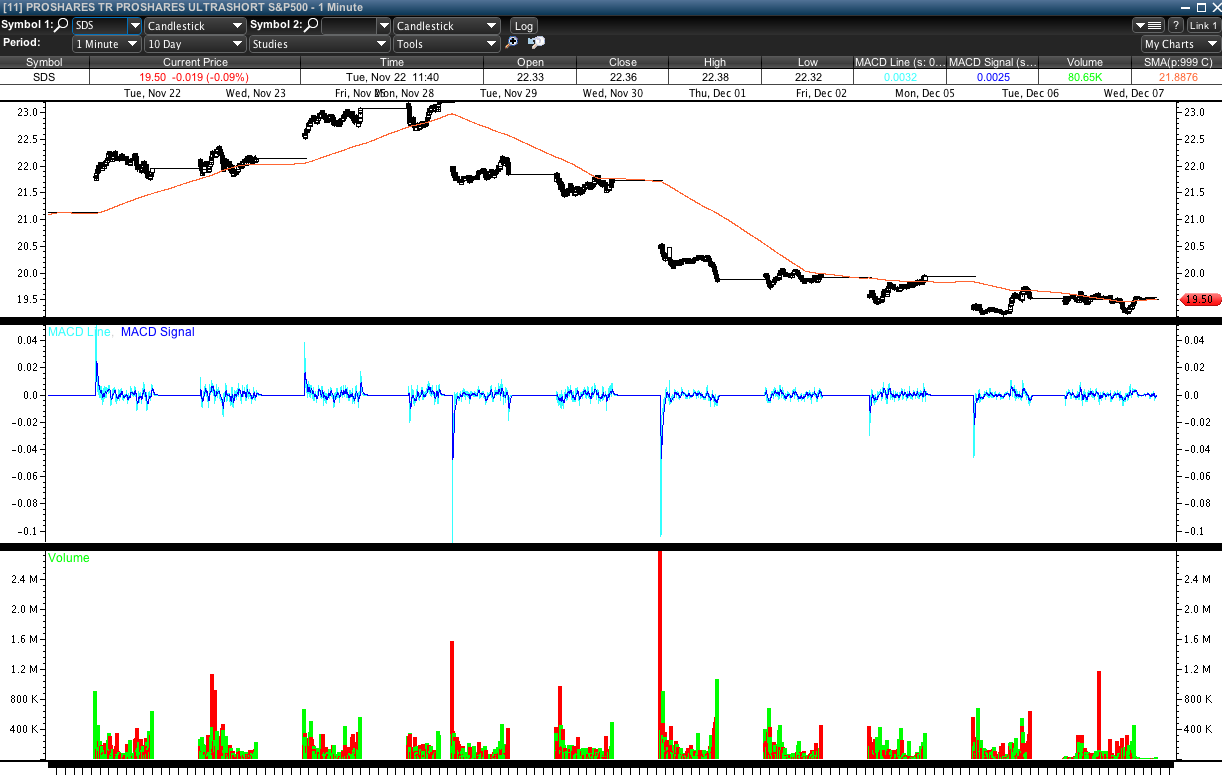
On 11/30 I began echoing a previous SDS trading plan to scale into SDS. With half position size on 12/6/11, I decided to double down my position in anticipation of a turning point.
12/6/11 I noticed some flattening in the price action of SDS as well as a nice bounce above the monthly pitchfork levels acting as support.
If the follow through was not there EOD I would sell. As well, I set a much tighter stop on these shares than the swing position that I am scaling into for SDS. It was an attempt at trading around a position. Something that I don’t normally do.
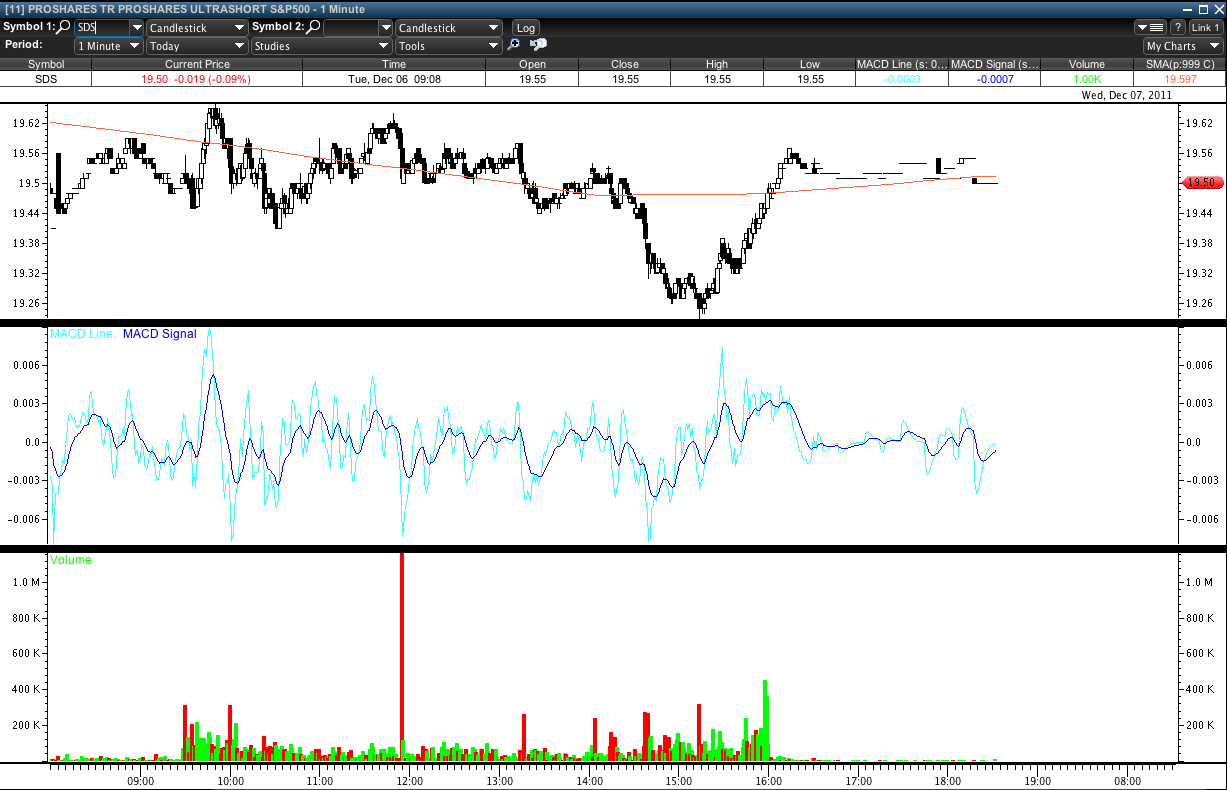
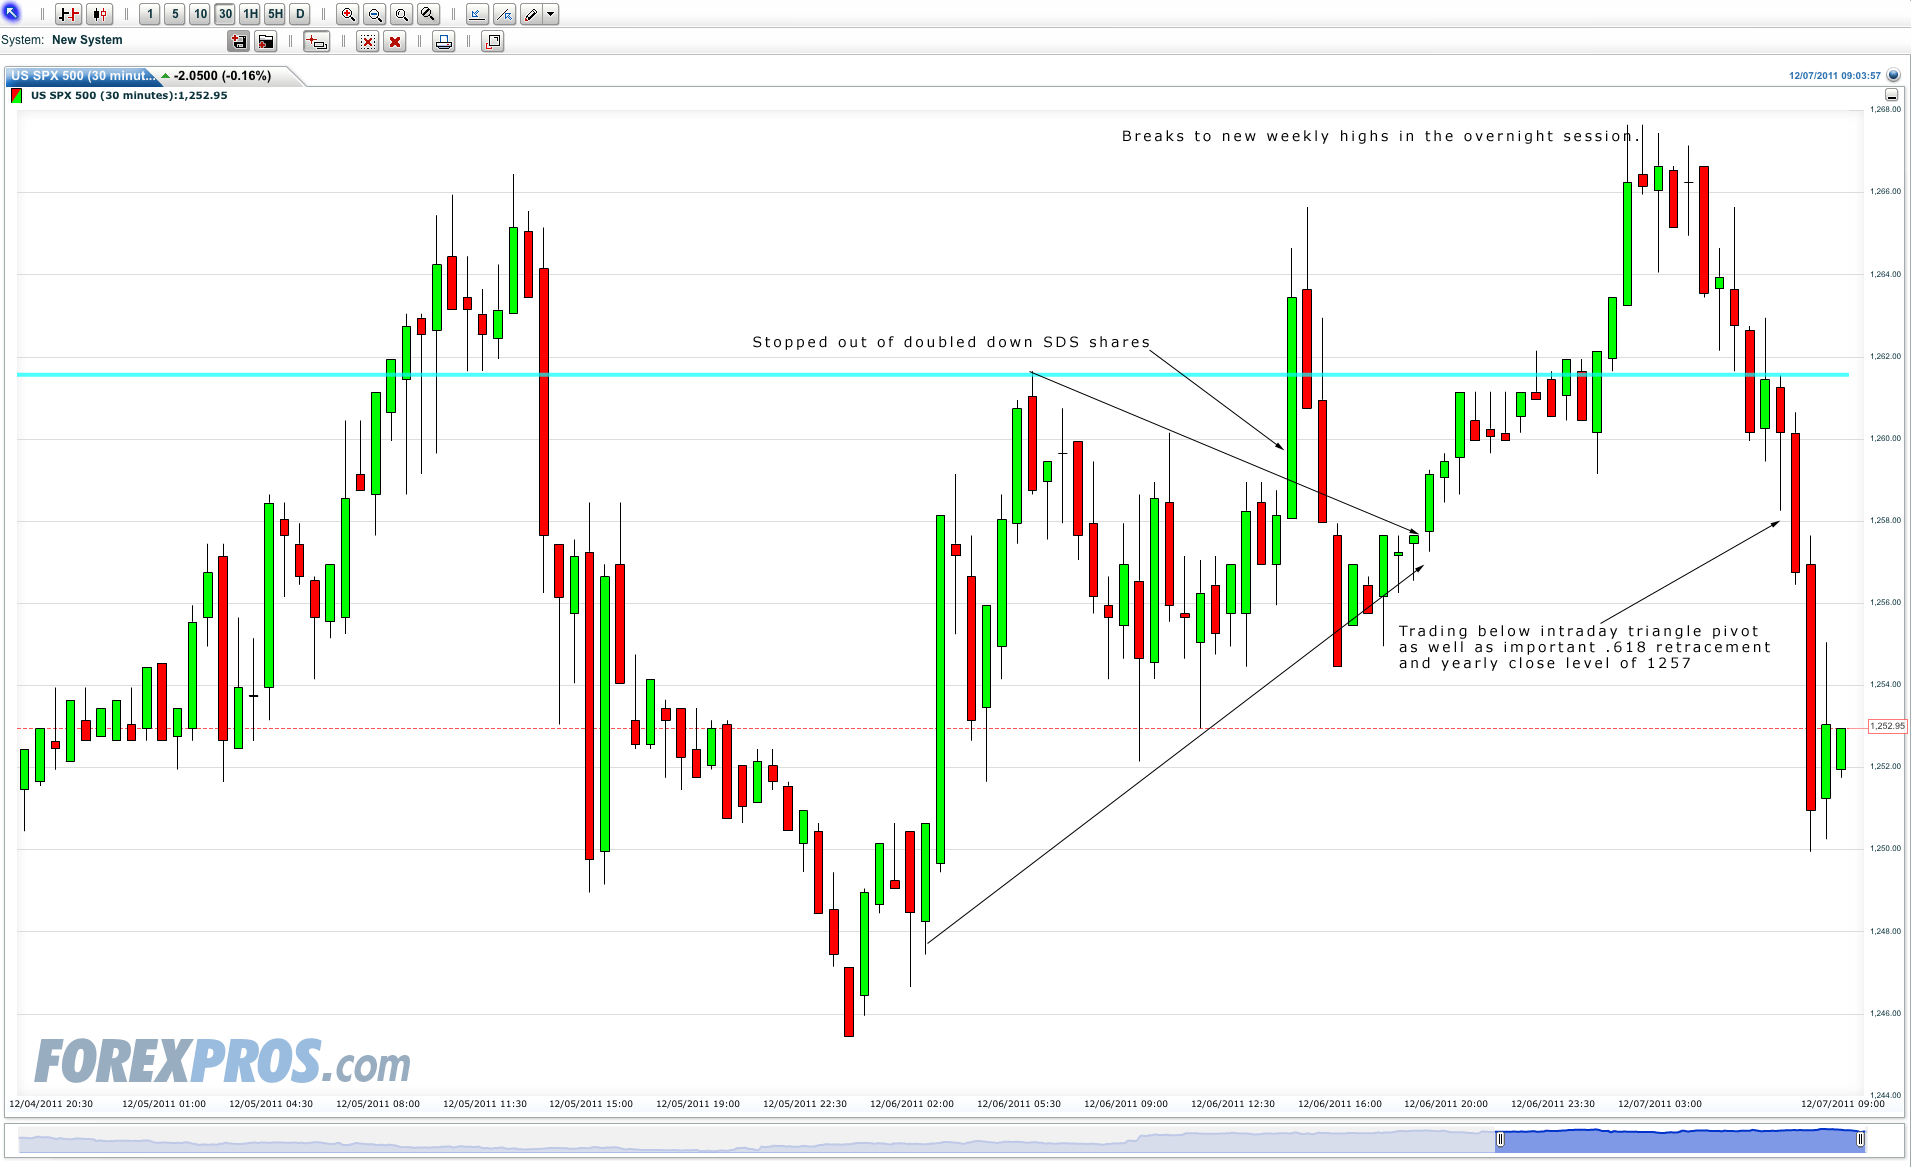
Buying at 19.54 I set my stop just below the low of the day and got stopped out. Unfortunately my trading platform selected the wrong lots and I ended up selling out of my swing shares instead of the shares I wished to trade with. This was my error for not realizing first in first out was set on my trading platform.
In this case I took a.60 cent loss on the SDS position and now hold same amount of shares at a basis of 19.54, which is currently flat after a midday selloff.
The late day selloff held the 19.03 low successfully as well the rally closed above the monthly pitchfork levels that I have charted.
Currently there is very little momentum in rallies and yet it appears that ES_F keeps blowing through stop levels. In such a low momentum environment timing has been extremely difficult which is why I have chosen in this particular trade to scale in. Even gaps have shown to spark little momentum according to indicators.
A loss was taken 12/6/11 on partial shares, and a mistake in execution cost me more than I had anticipated. Conversely, I have lowered my cost basis by about .40 cents, but I will have to recoup those loses IF my trading plan to scale into the SDS becomes profitable lowering my risk reward ratio.
Prior to entering the trade 12/6/11 I decided not to add to my position on a retest of the prior days close, 19.20. I had decided that if a retest of the lows occurred that new lows would likely come. The close above the monthly 19.41 level is important but the volume weighted average is acting as resistance at very short time frames.
I can’t say that my conviction in the trade has yet changed despite, again, wavering from my exact plan- perhaps I am being lulled into action by the lack of momentum. Either way, studying the outcome of this trade and comparing it to the prior trade in SDS where scaling was used may uncover a huge trading flaw within my plan.
That said, I also have again put on a trade in the ERY. A buy at 11.65. So far ERY has traded to a low of 10.75 and held that low 12/6/11 closing around 11.15.
–Adding to 12/6/11 trade analysis prior to posting on 12/7/11–
Lasst nights ES_F ran to 1267, marginally taking out Mondays highs, yet they now trade at 1250 and the SDS may open marginally higher- 19.60’s trading right now with a high of 19.72 premarket.
This isn’t a guarantee that prices have pivoted here, but it does continue to press on issues of timing and my inference has been reoccurring regarding timing but not yet verified. I seem to always be a day or two early and or too aggressive just prior to expectations. I need to fine tune these anticipatory signals to better fit my trading plan or perhaps allow for this slippage.
Further, it is noteworthy that I have been underestimating the possibility that price within the SDS and ERY will hold there lows. So far ERY has broken its November low and SDS has not. This is partly due to the deteriorating factors of the correlations of the ETF but also because I believe the current trading environment caters to “no holds barred” price action at the moment. It has been very difficult.


