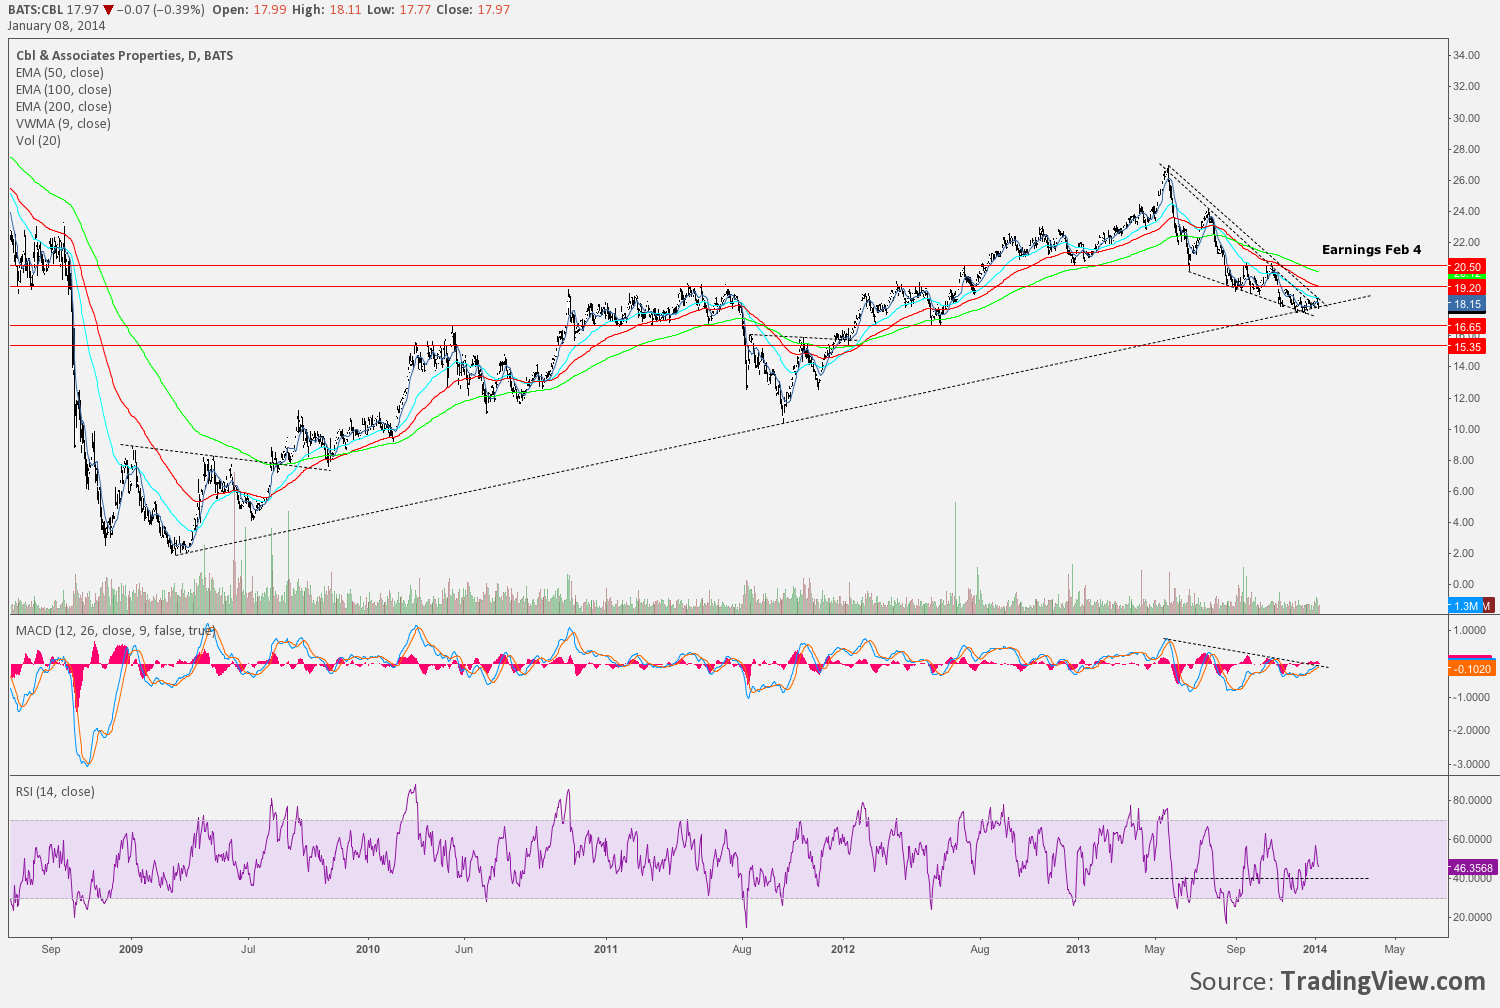
CBL had been trading sideways along a long term trend line from 2009. I first flagged the chart on Jan 8.
After CBL had a large volume inside day on Jan 10 CBL closed above its 9vWMA on Jan 14. On Jan 15 I bought in the OS after a new high was made. CBL did little but go sideways and lower into the close. The trade plan called for buying on close above 9vWMA and 1$ stop.
After the close on Jan 15, CBL announced multiple redevelopment plans due to JCP closings.
The stock gapped down on Jan 16 and was downgraded by JPM to neutral.
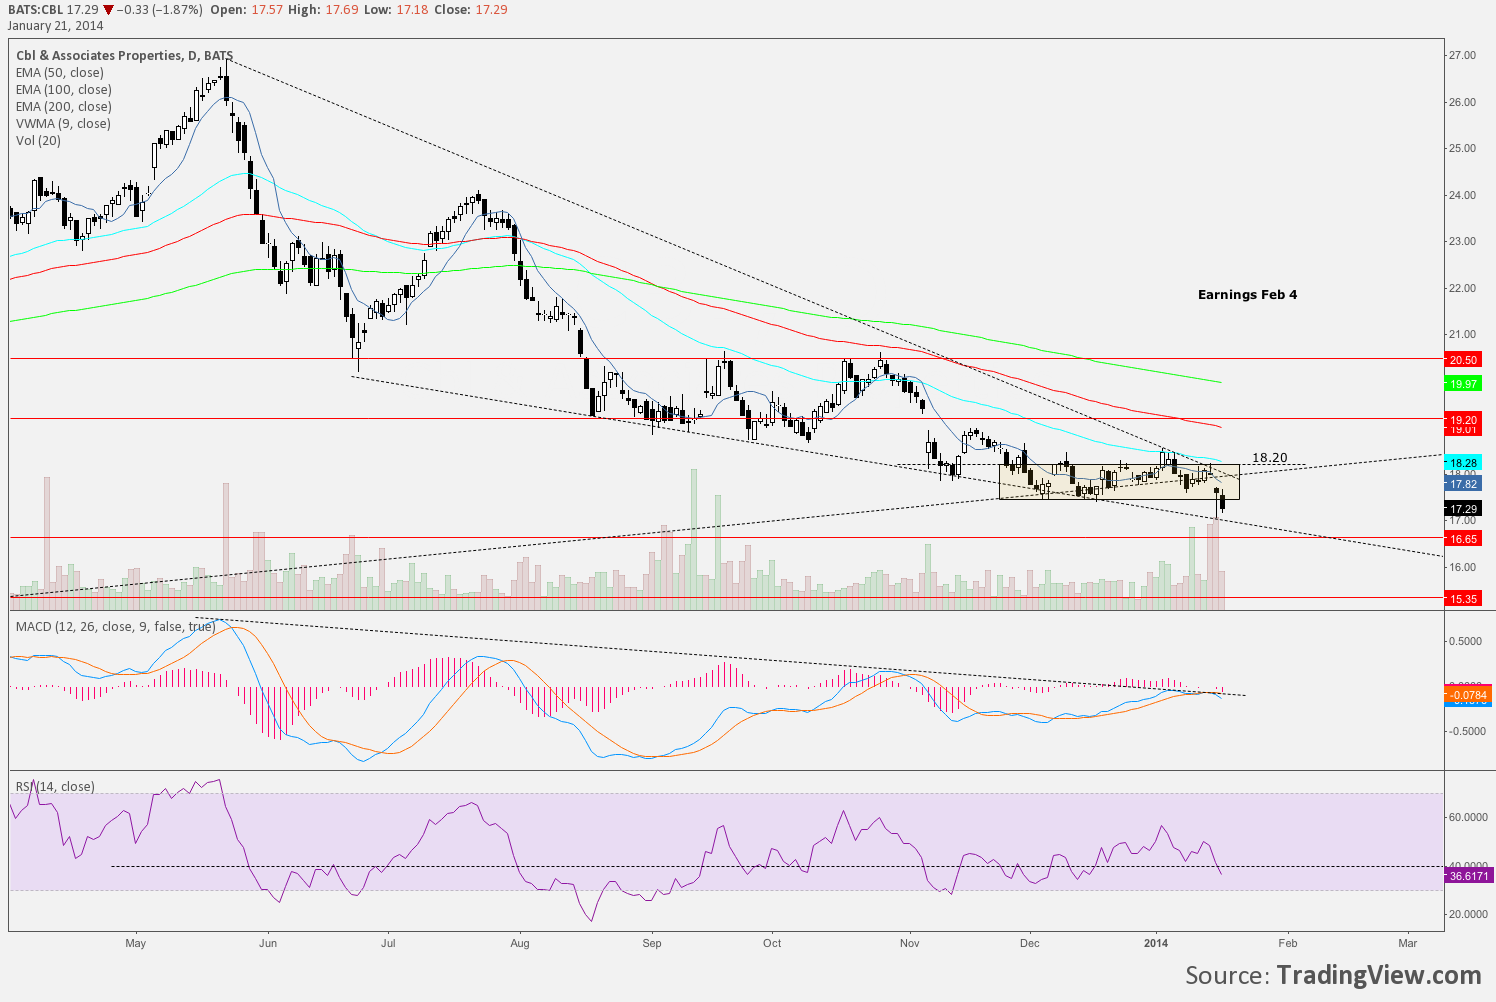
I took my loss near the lows of the day on Jan 16. The chart below is from Jan 21 and shows the gap and weakness below the consolidation box at TL.
One other downgrade came today Jan 22 as well as a CBL announcement of opportunities for JCP properties. All of which is filler to price action and which I do not care about, but events were not priced in it seems.
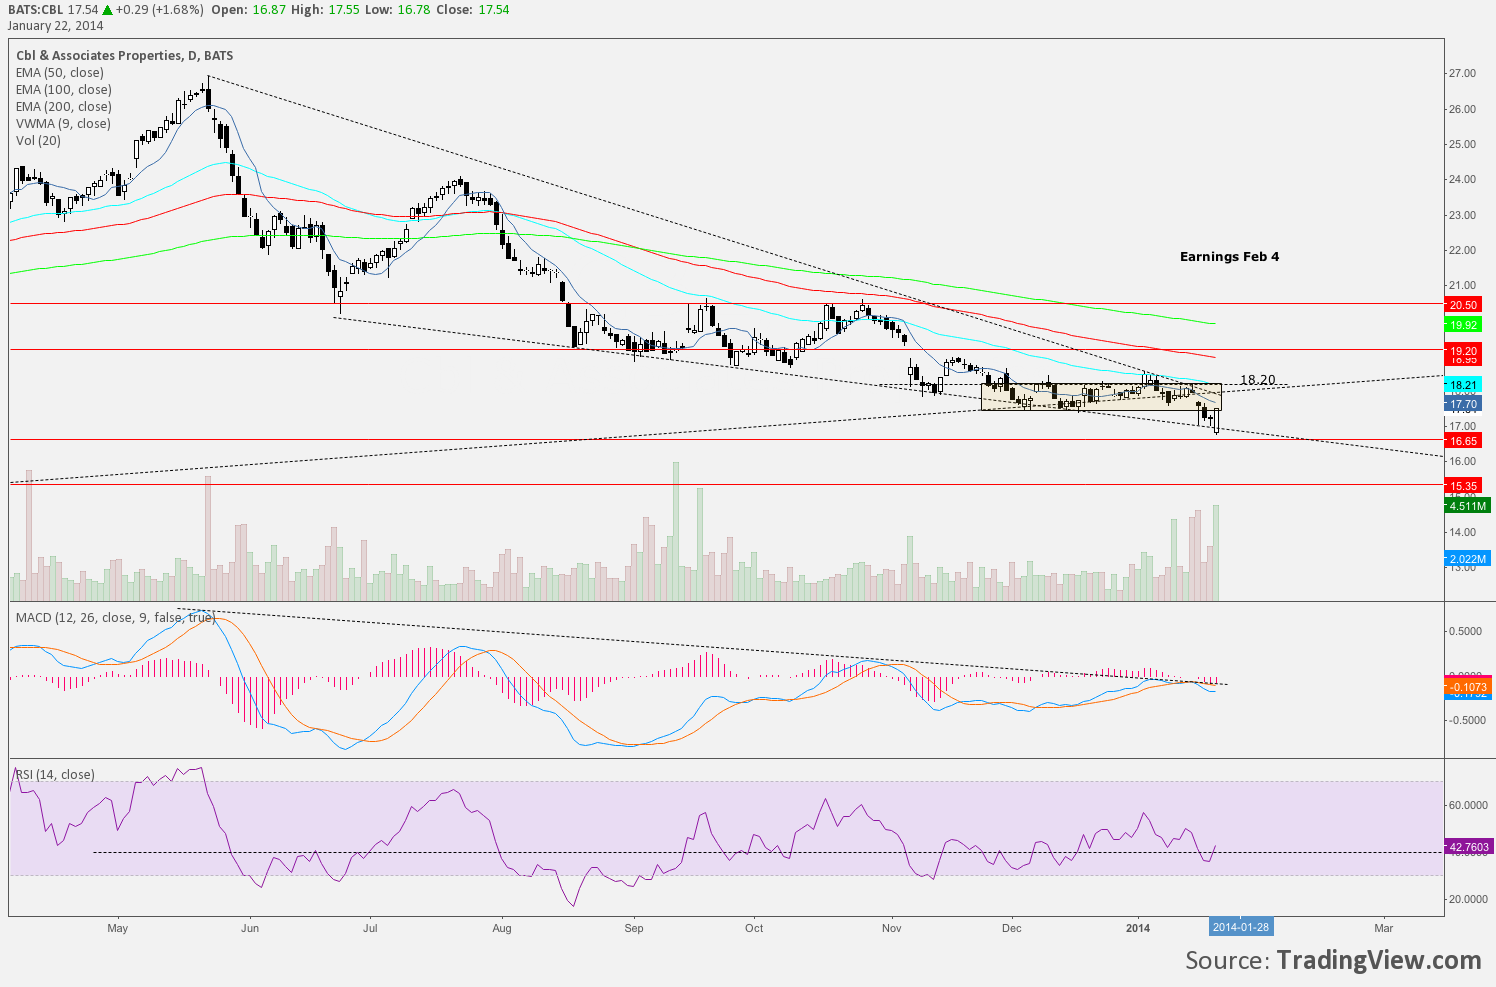
Today CBL gapped lower again towards the 16.65 support level and through the lower falling wedge TL.
18.20 is the top of the box intermediate SupRes within the falling moving averages and long term TL. Support at 16.65 and 15.35.
Upon close it is possible CBL has completed a reversal day, bullish engulfing candle on large volume. RSI has broken back above 40, MACD is curling but has been held down before. No current position.


