|
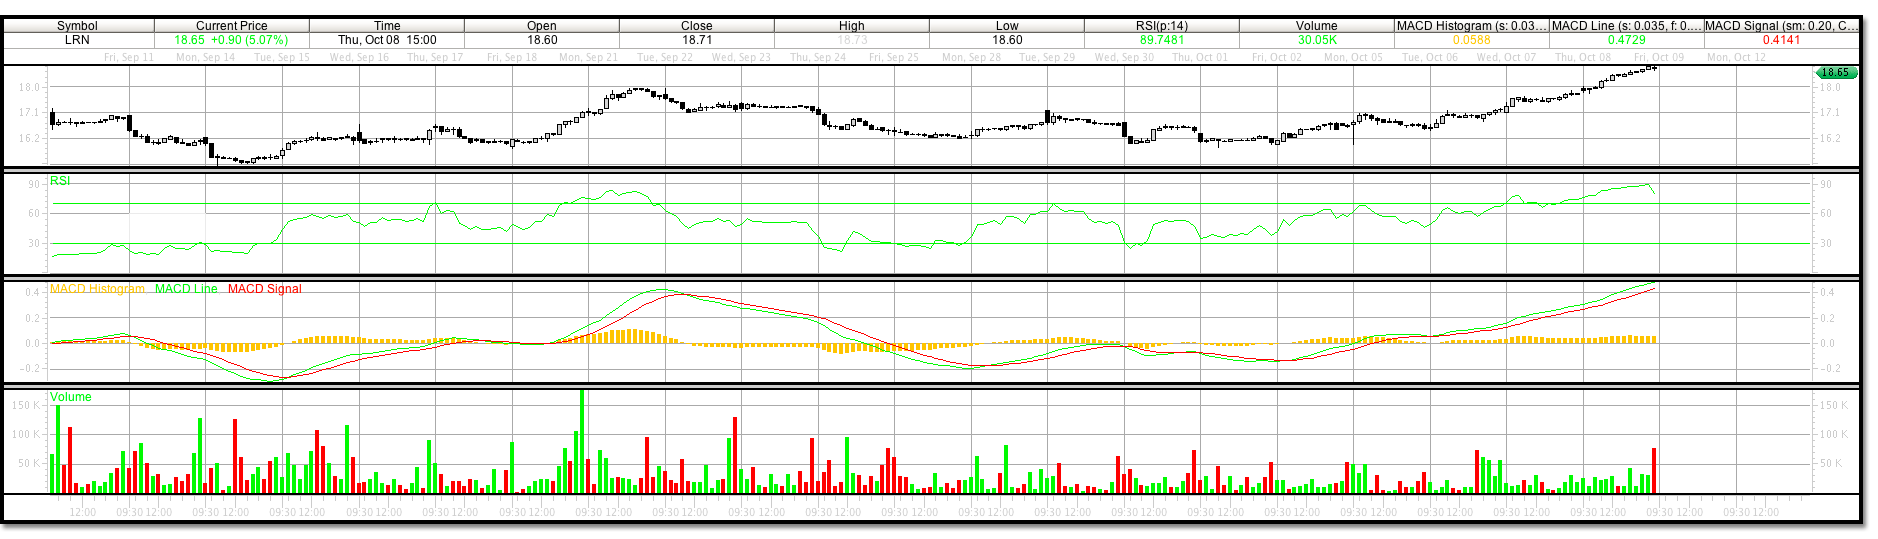
Buy trading signal triggered on LRN on September 11, 2009**.
|
| LRN- Buy signal triggered on LRN on September 11, 2009* | |
| Trading signal for 30 minute price bars | |
| Buy price: $16.00 | |
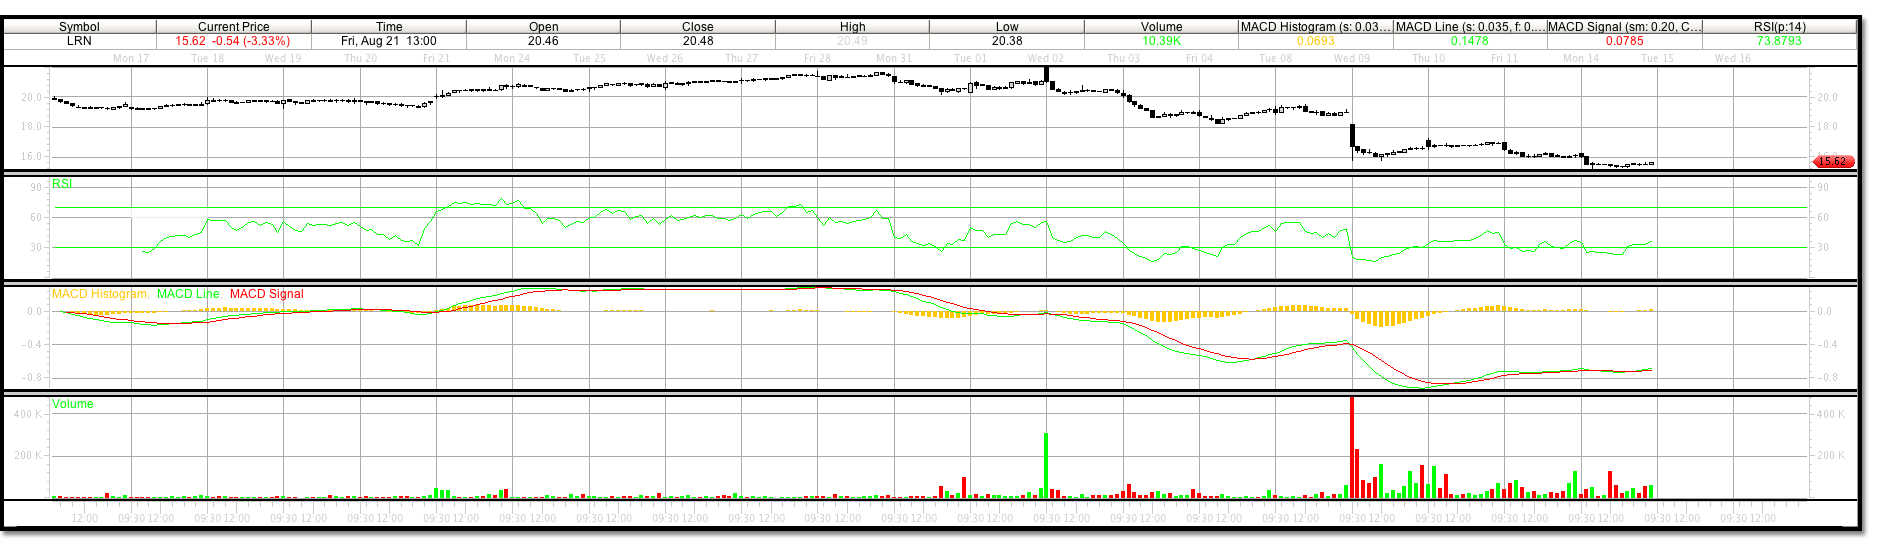
| Sell stop price: $15.74 | LEVEL HIT – September 14, 2009 |
| Short term profit level: $18.545 | LEVEL HIT – October 8, 2009 |
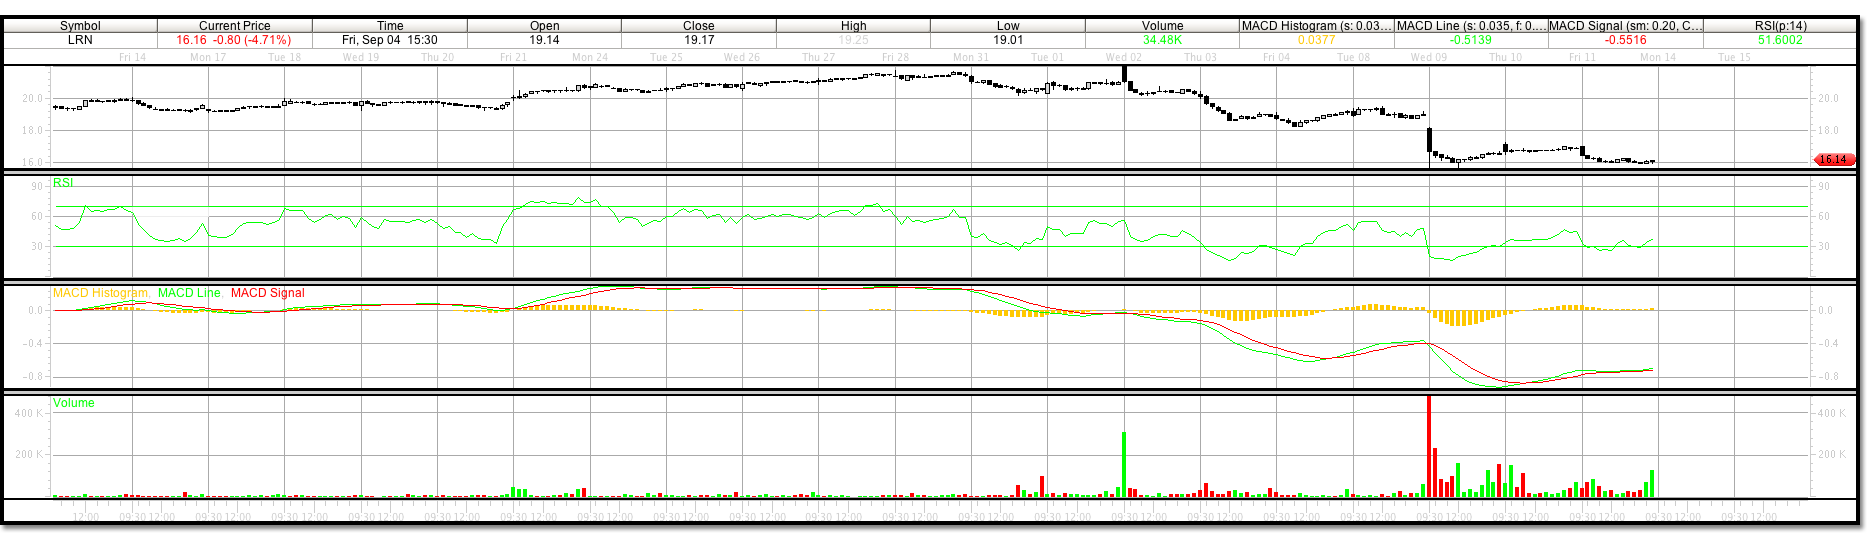
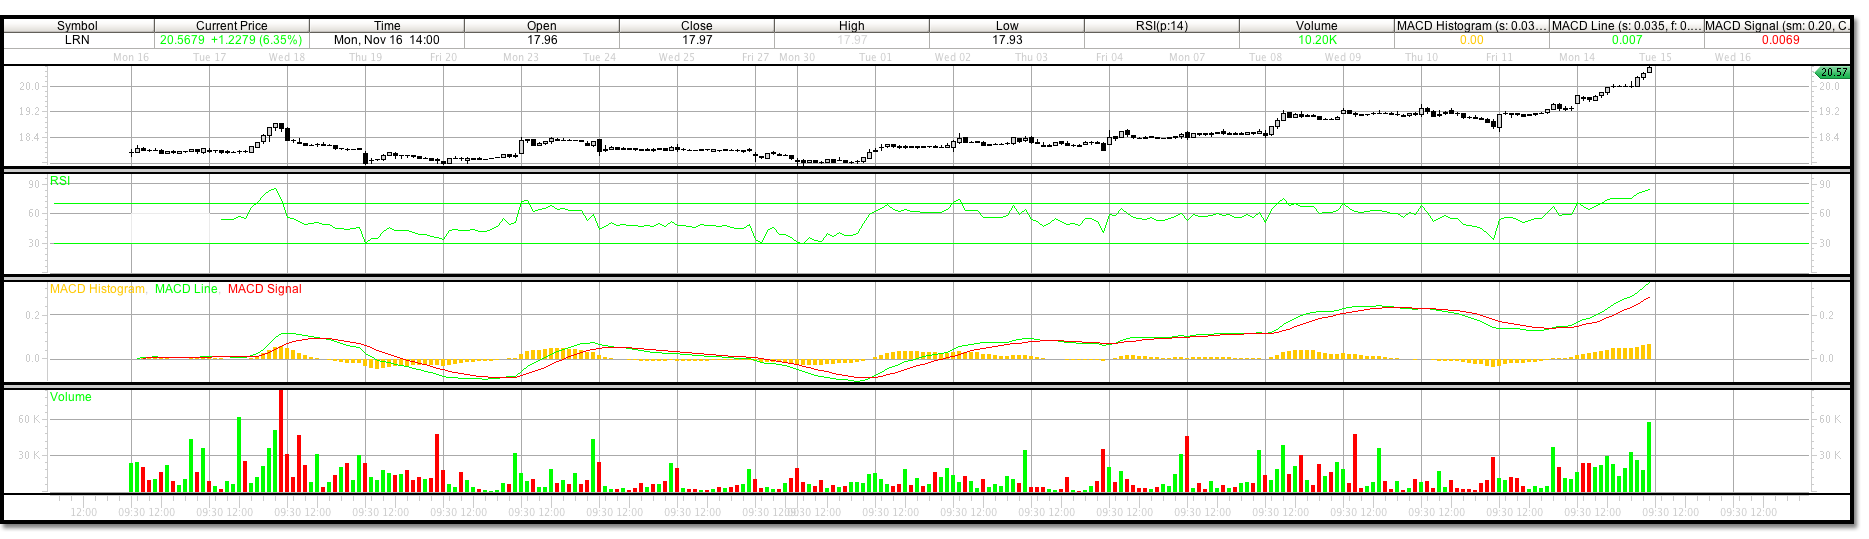
| Long term profit level: $20.2725 | LEVEL HIT – December 14, 2009 |
| Current Google® Finance Quote |
|
LRN triggered our sell stop price of 15.74 on September 14, 2009 and bottomed that same day at 5.33 about four hours later. Often this can be attributed to reading a MACD wave count incorrectly. To try and understand the timing involved it is key to know that the final wave of a correction always has 5 waves and a wave 3, although not broken in MACD levels by a corrective wave 5, can be broken in price unless a triangle correction forms. The cycle of trading that happens between the wave 3 and wave 5 bottoming process can be described at times as a washout in certain instances. |