In early February the noise regarding the underperformance of Financials was getting very loud. There have been some clues along the way worth noting and have held up so far despite there still being skepticis about. The charts and comments below mapped the potential for a possible pivot low through early February. This is a review of those charts and thoughts.
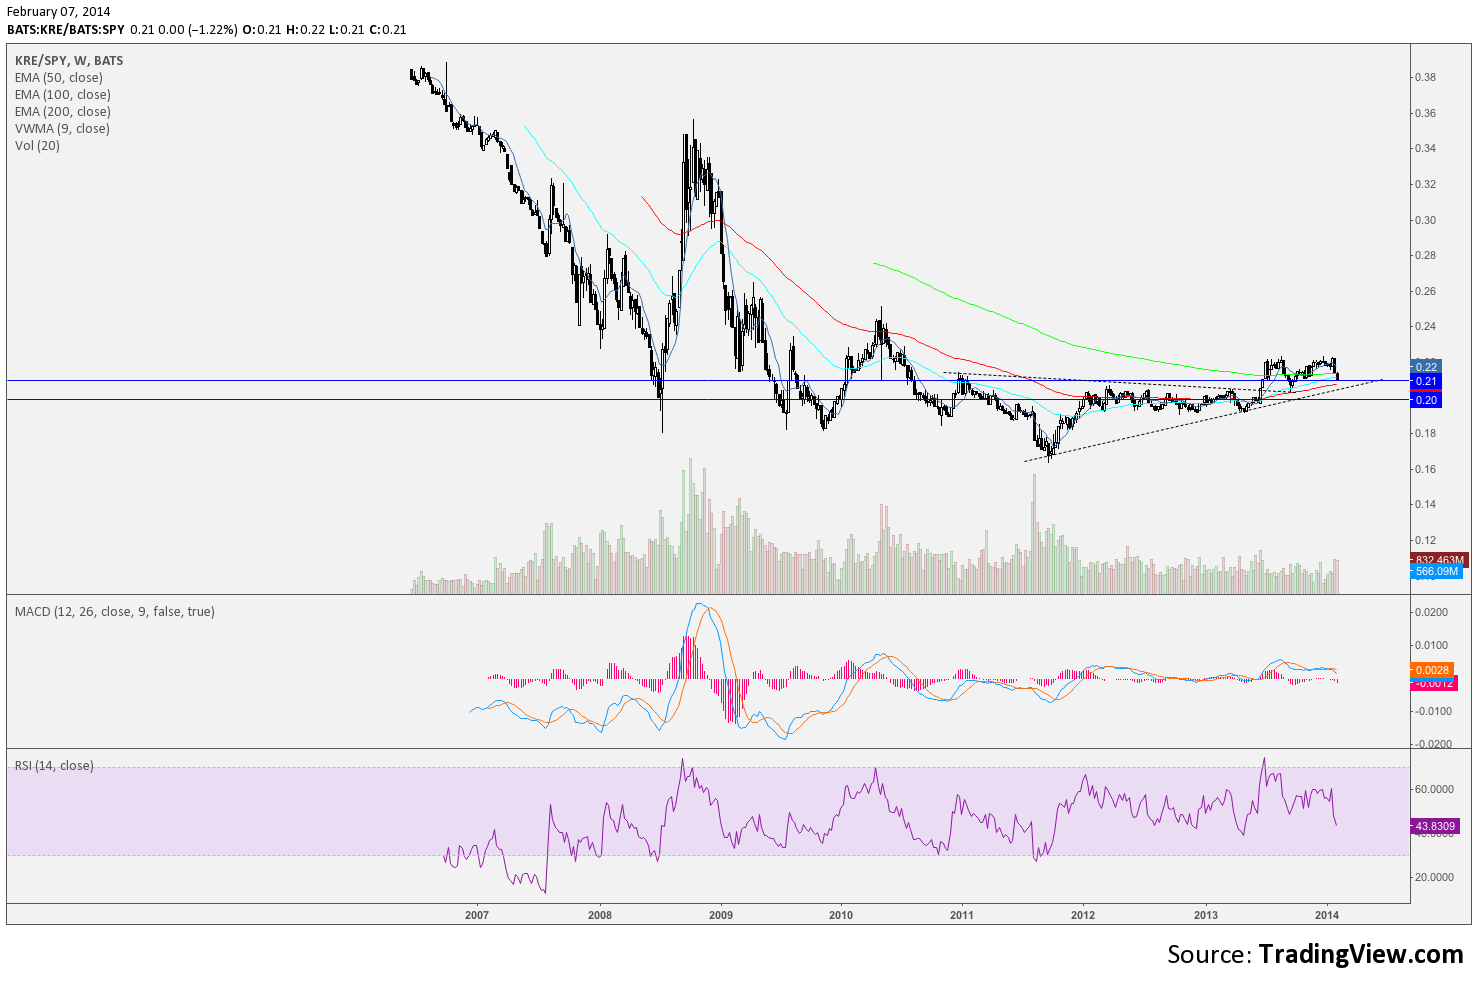
KRE vs SPY weekly appeared to be backtesting a major breakout and either at or near trend support. Noted February 7.
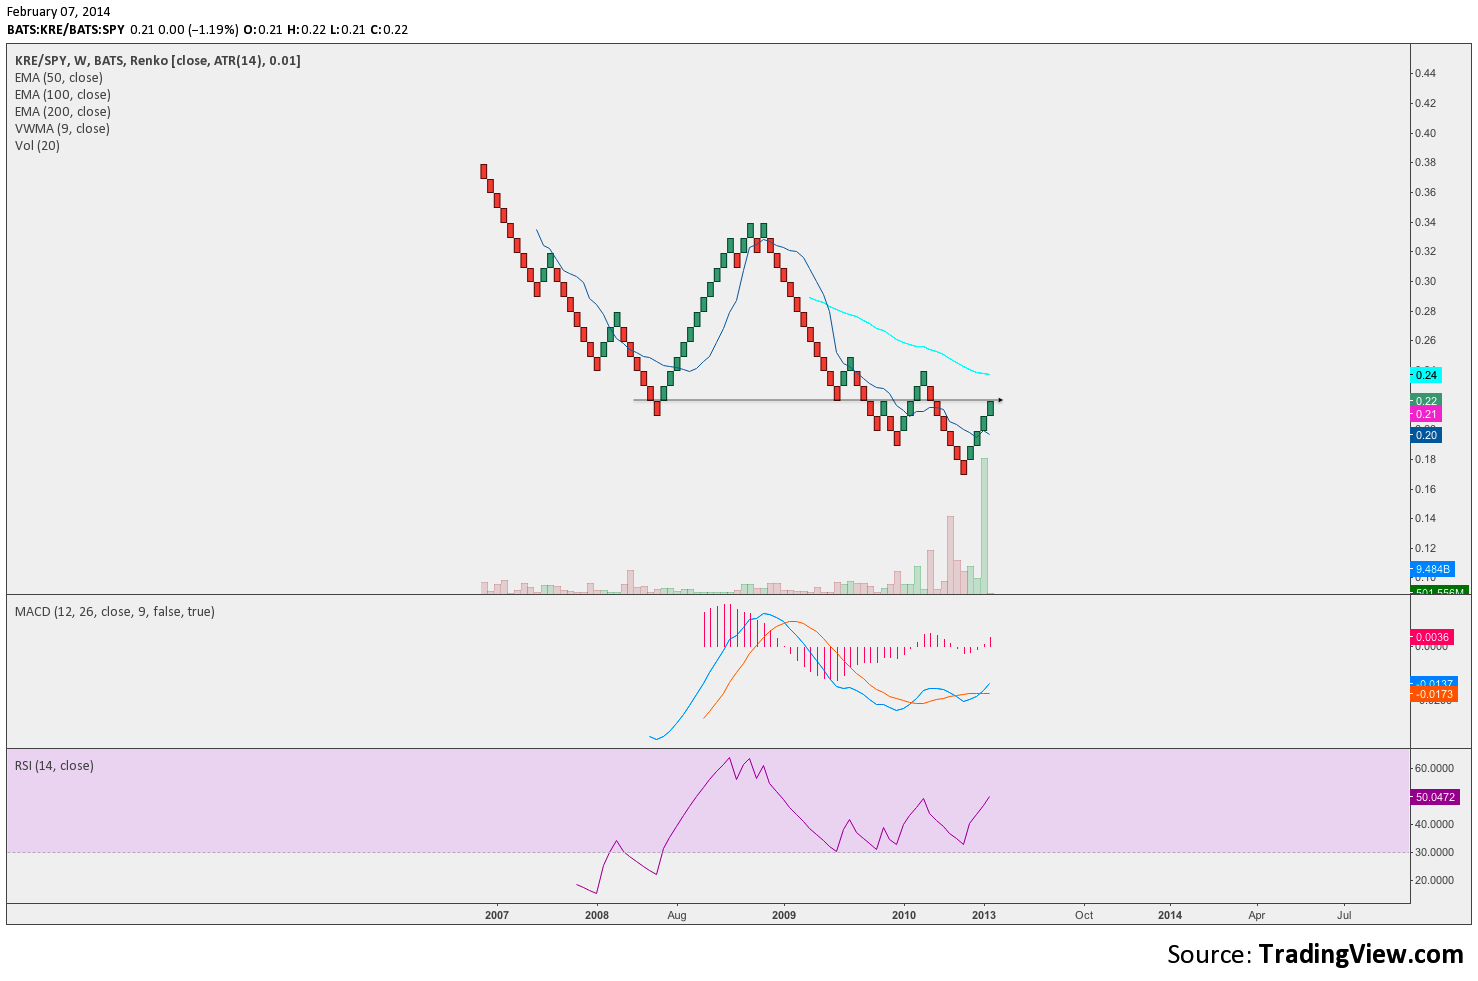
KRE vs SPY weekly renko chart showed great divergence to its lows and at an important support resistance level. Noted February 7.
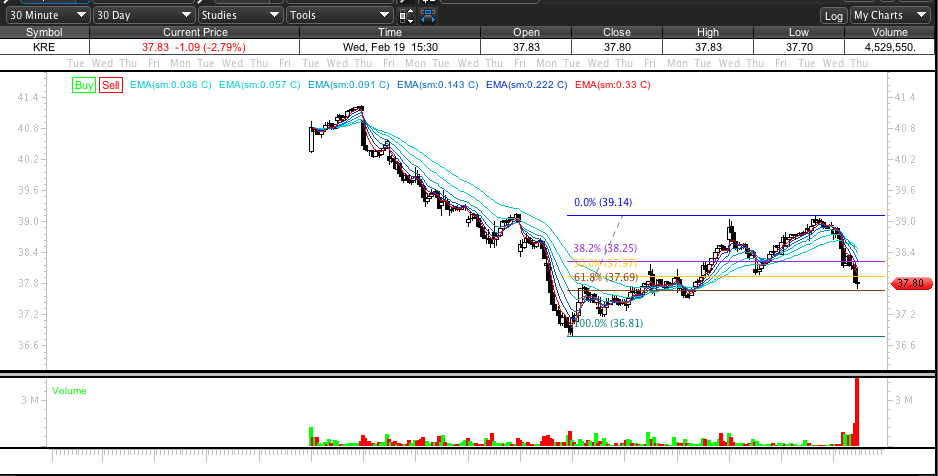
The 30min KRE chart below holds perhaps what I found most interesting and valuable in its notes. Noted February 7.
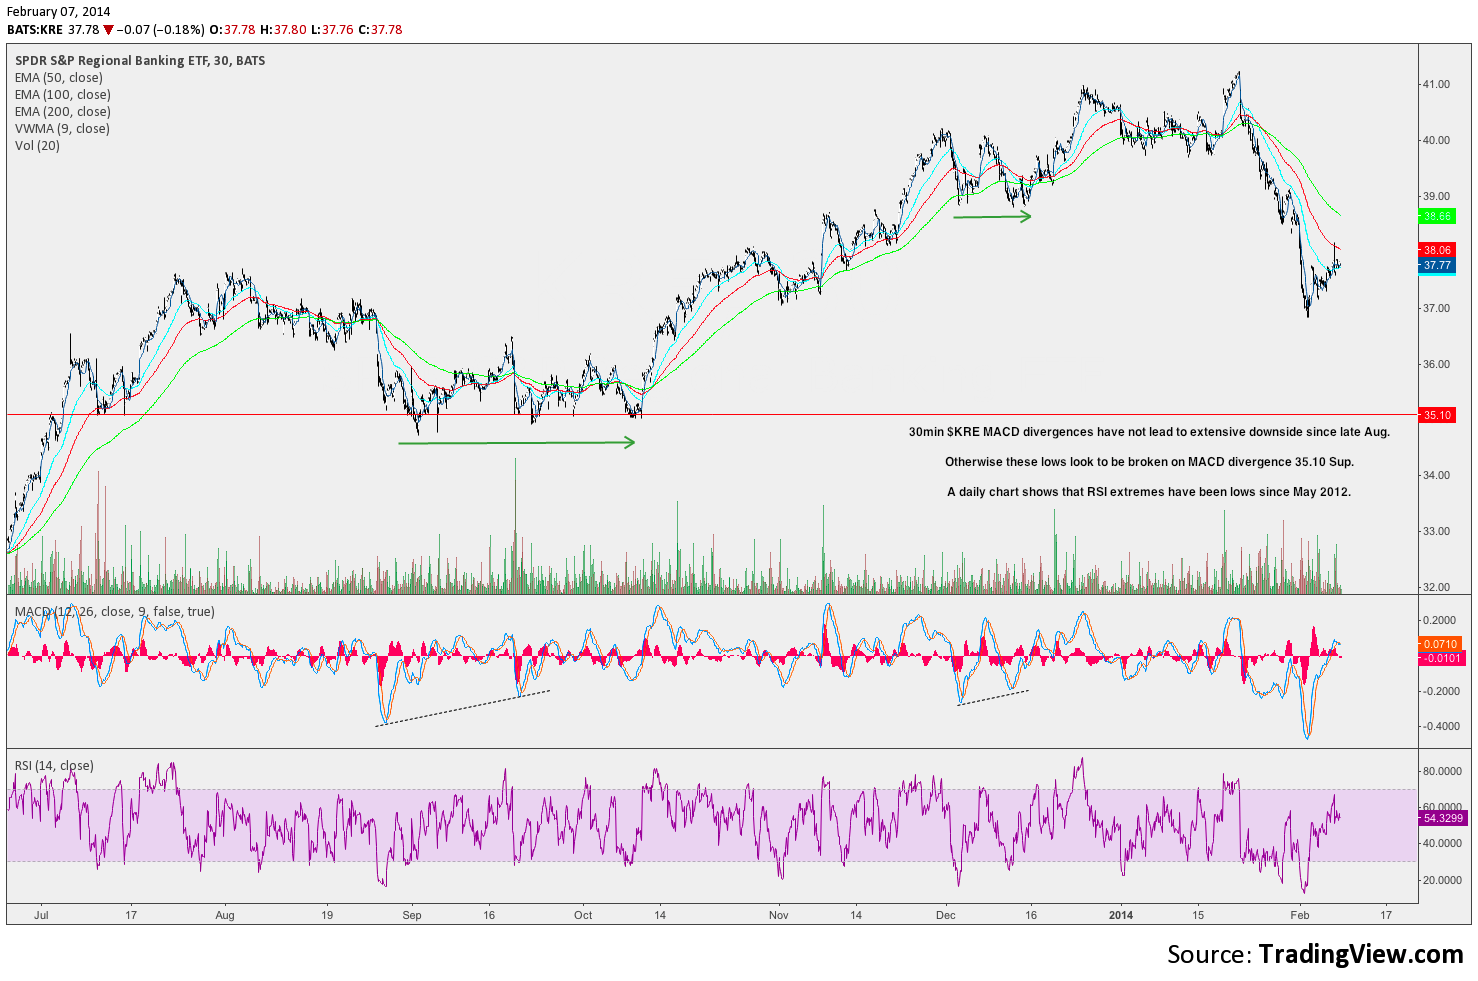
Specifically, not only have 30min divergence not lead to extensive down moves in the past but more importantly a daily chart shows that RSI extremes have been lows since May 2012. Positive RSI divergences have been the norm for turning points at the daily time frame.
The KRE did pull back from that nice bounce off RSI extreme. A gap lower after this Fibonacci test was bought. Noted Feb 19.
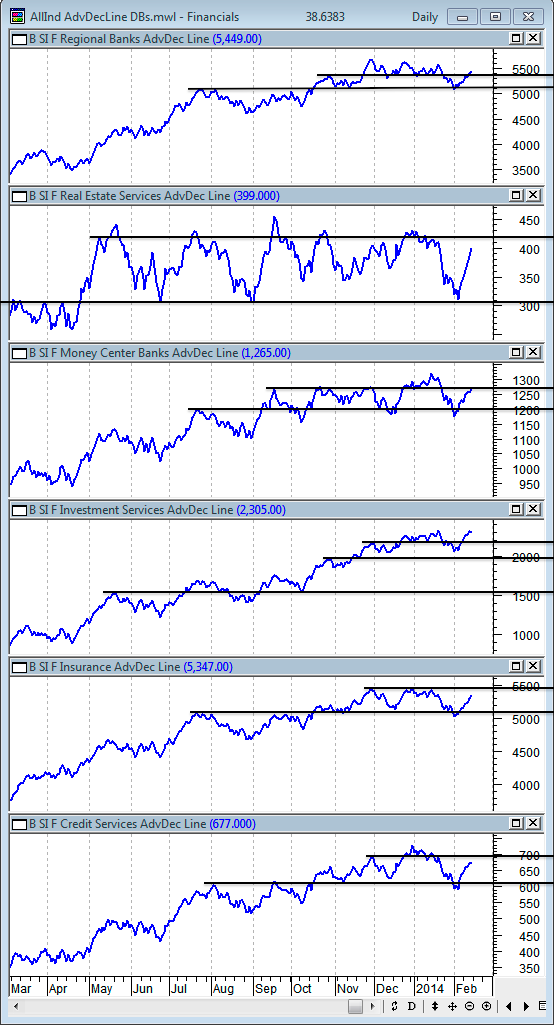
I also focused on @gtlacky breadth review of financials. I strictly have looked at chart technicals in past. These reviews have been extremely interesting, actionable and silenced the noise for the past three weeks as the markets swooned. GT is a professional and has valuable information on his site. Find his Strength In Numbers breadth reviews with this link.
Some simple trend lines on sub sector financials from February 16 GT report. Good or bad the financials as a whole had just tested major support areas in their breadth charts and recovered nicely. Noted sentiment.
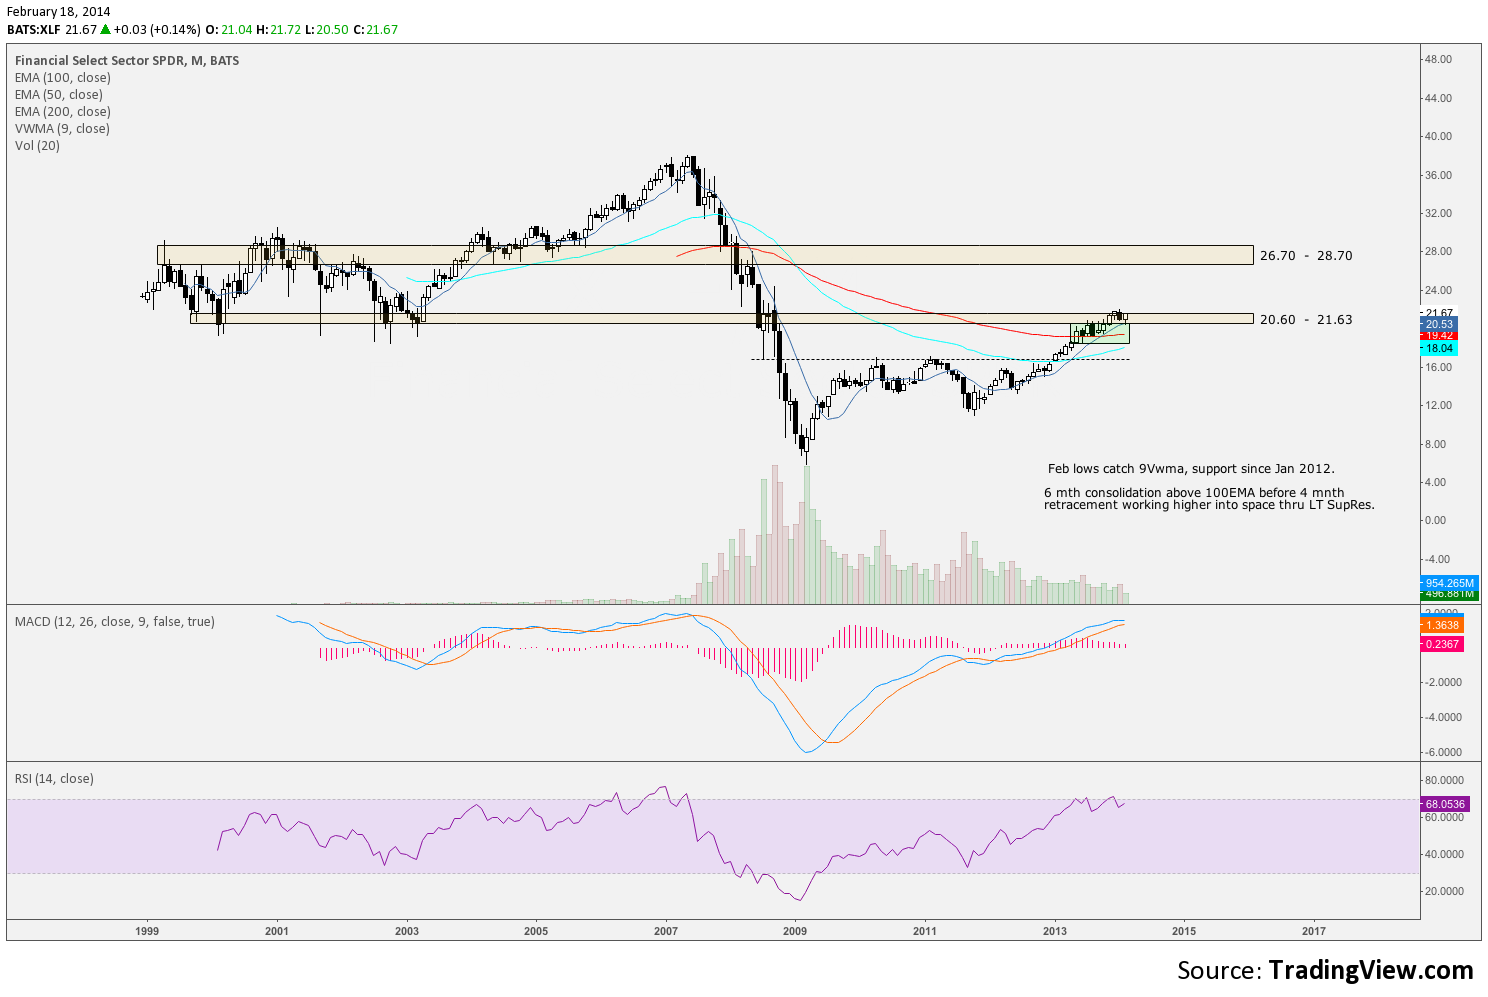
The XLF monthly chart levels. Noted here in a tight range February 18, chart below.
Next I looked at some things Im not sure are altogether relative. I looked at things Im not bullish on vs the XLF. Just about everything was outperforming vs the XLF. Are there any tipping points. IBB vs XLF was too easy and I think it still has room to go despite todays, March 6, selling.
Noted here chart below February 26 XLF GLD.
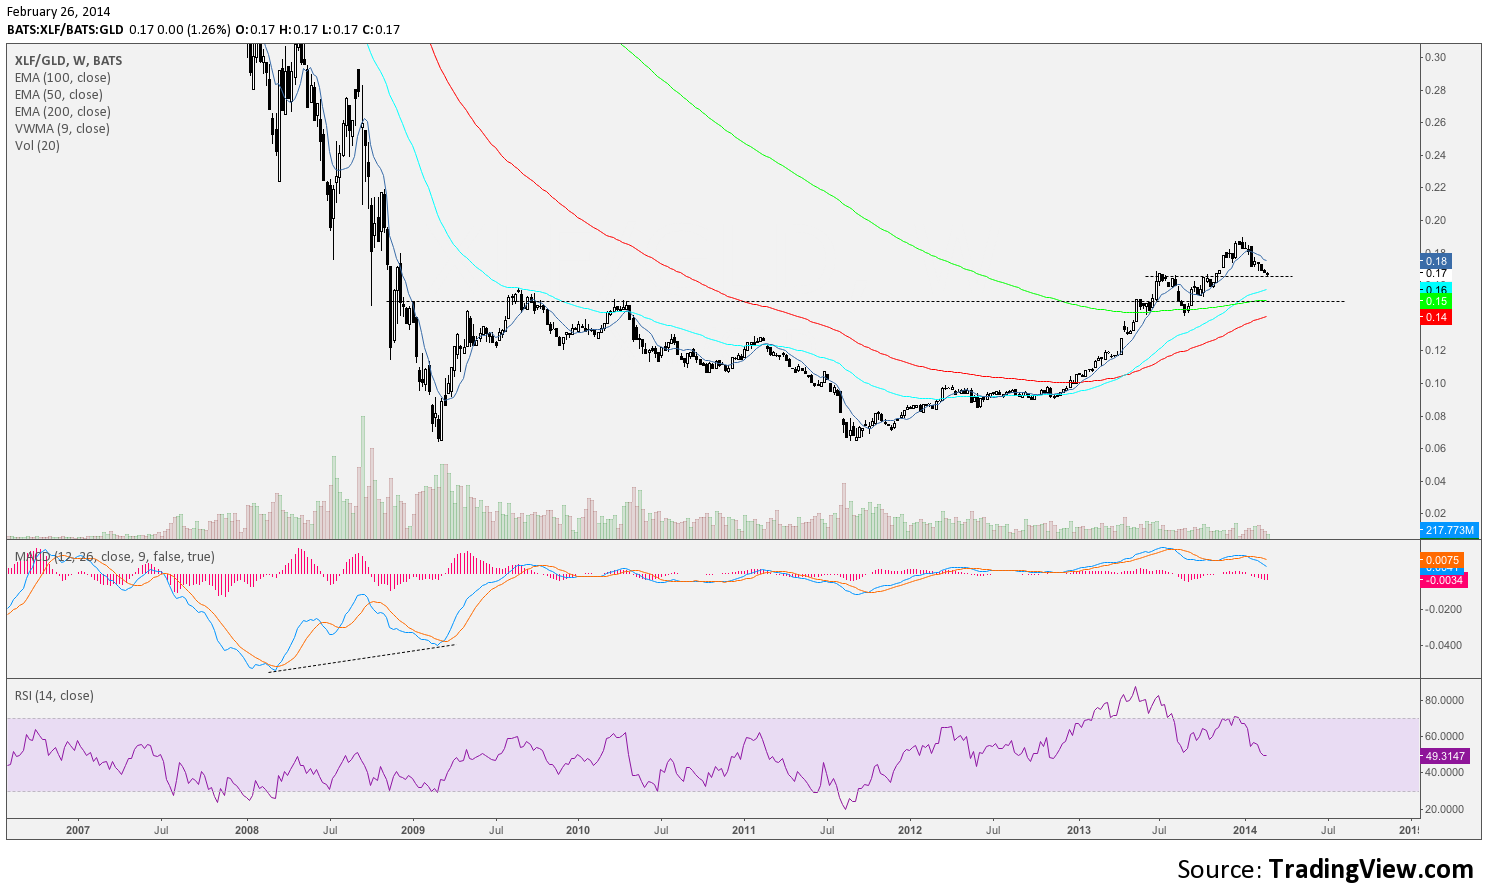
XLF is gaining vs Gold. I think gold is garbage, traded and squawked about it many times in the past. Basically theories of the past are being replaced by price action and in themselves the theories of past were always a reflection of price not the other way around. The sentiment comparison of where gold has come from and where Fins have been is still ripe for unwind.
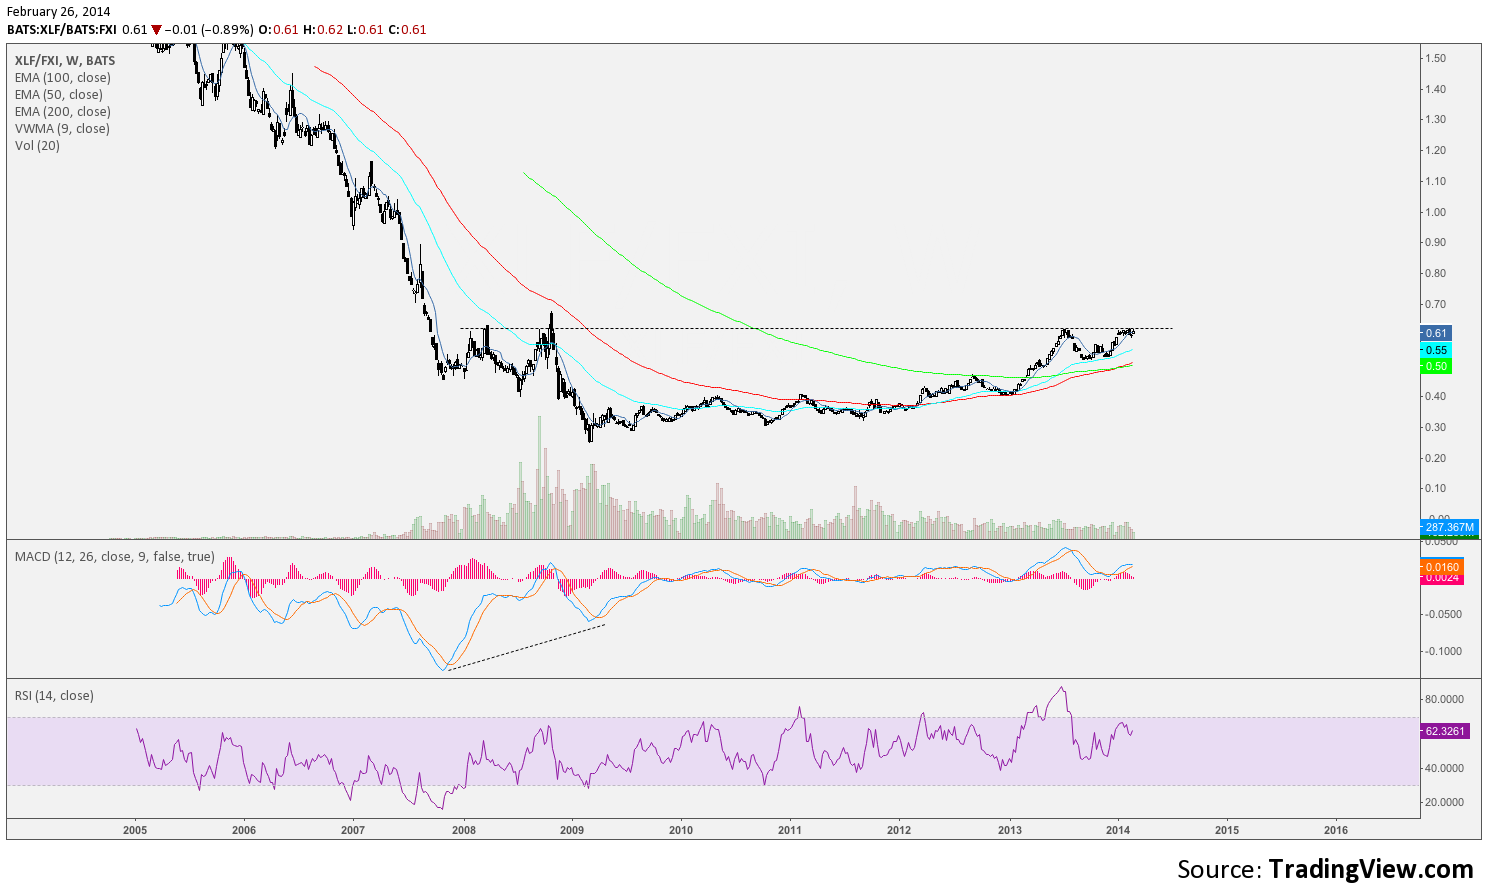
Further Ive been bearish China. Aside from the banking issues, growth, real estate, pollution etc…, the FXI vs SPY has been falling and still points lower. Its been volatile but I still think China has a date with lower prices. Here is a post on FXI (pre baby making news) interestingly we fight with those price/news levels still today.
XLF FXI noted here, chart below February 26. Looks ready to break out.
