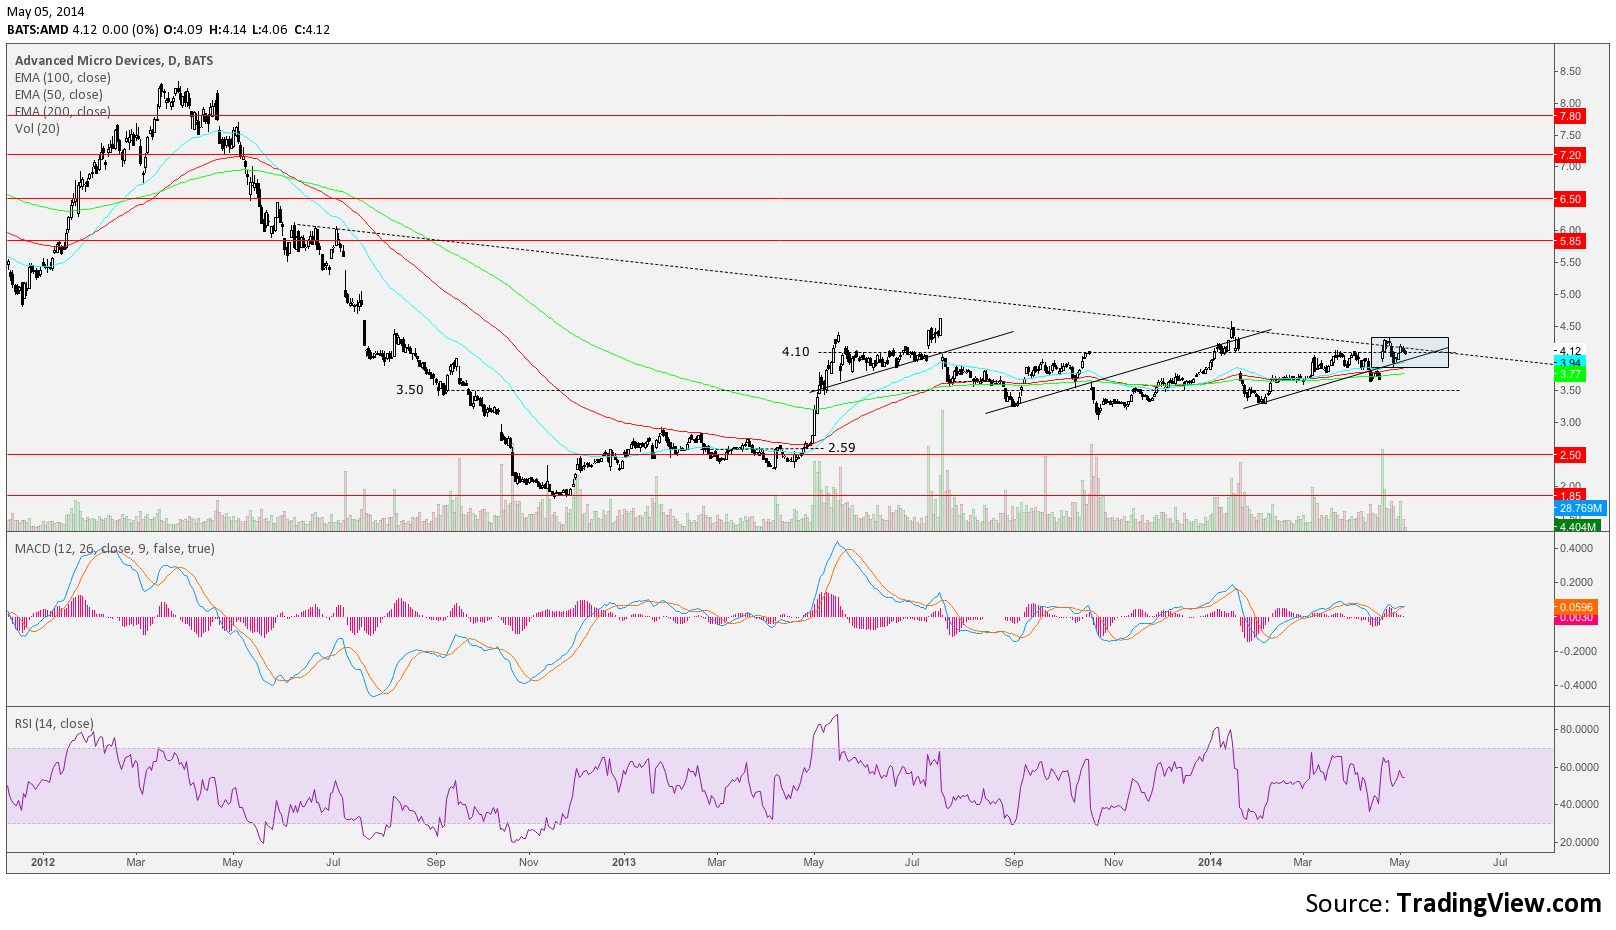
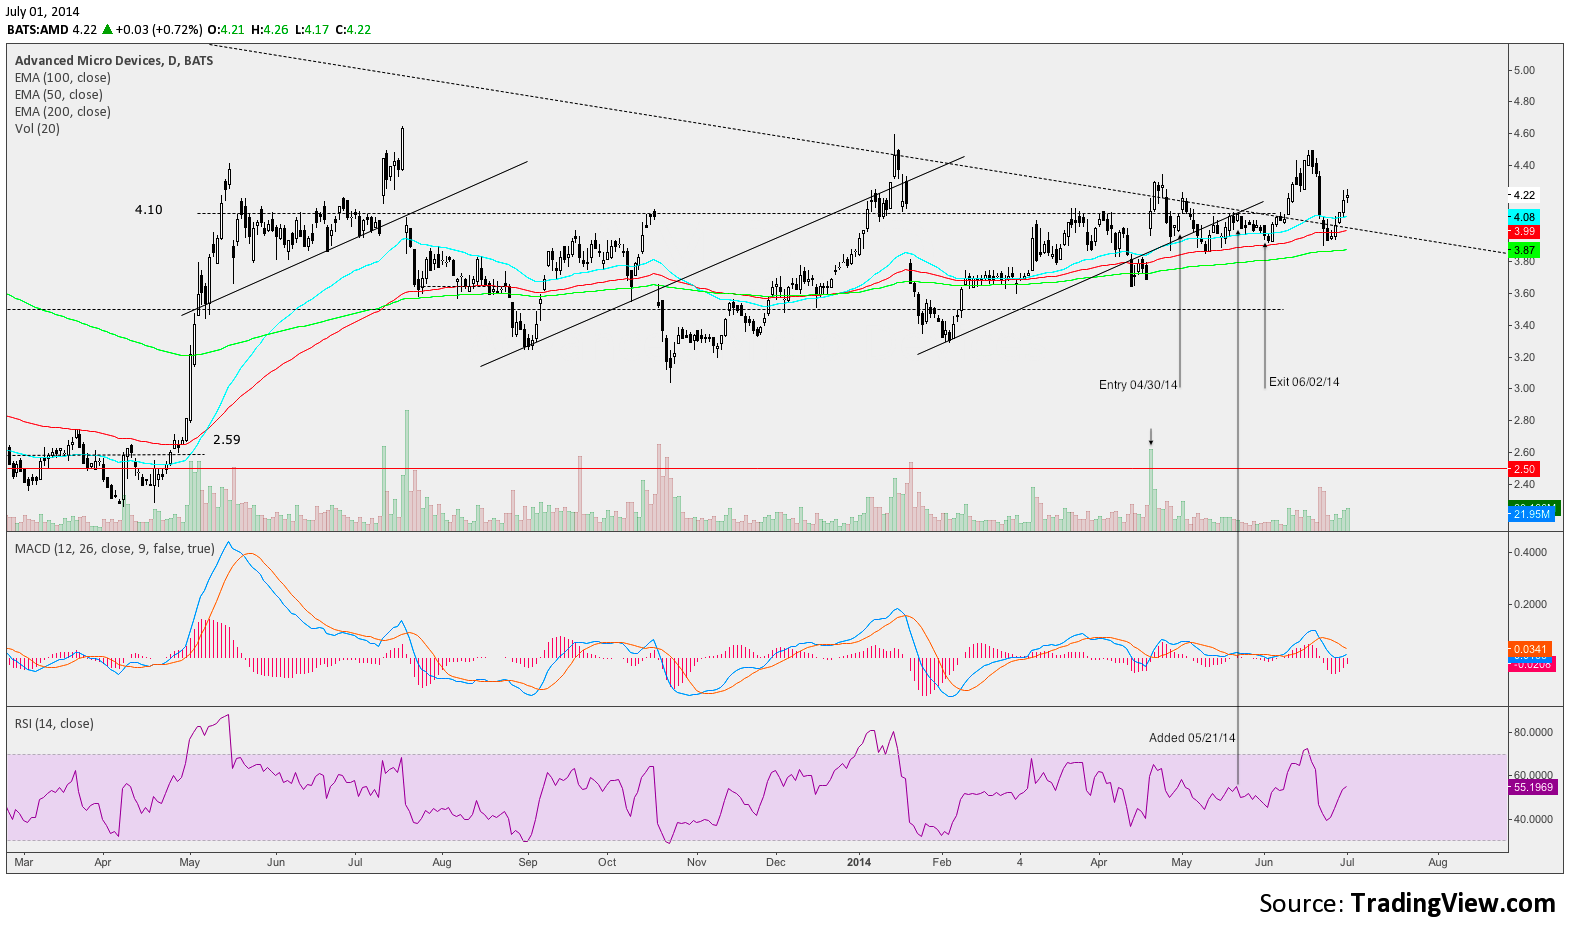
After breaking higher through TL resistance 4.10 with good volume 4/21 AMD pulled back and tested daily action reaction. Bought initial position on 4/30 engulfing candle. Did not have screen grab of chart entry for trade.
May 5, 2014 mid day look at AMD chart.

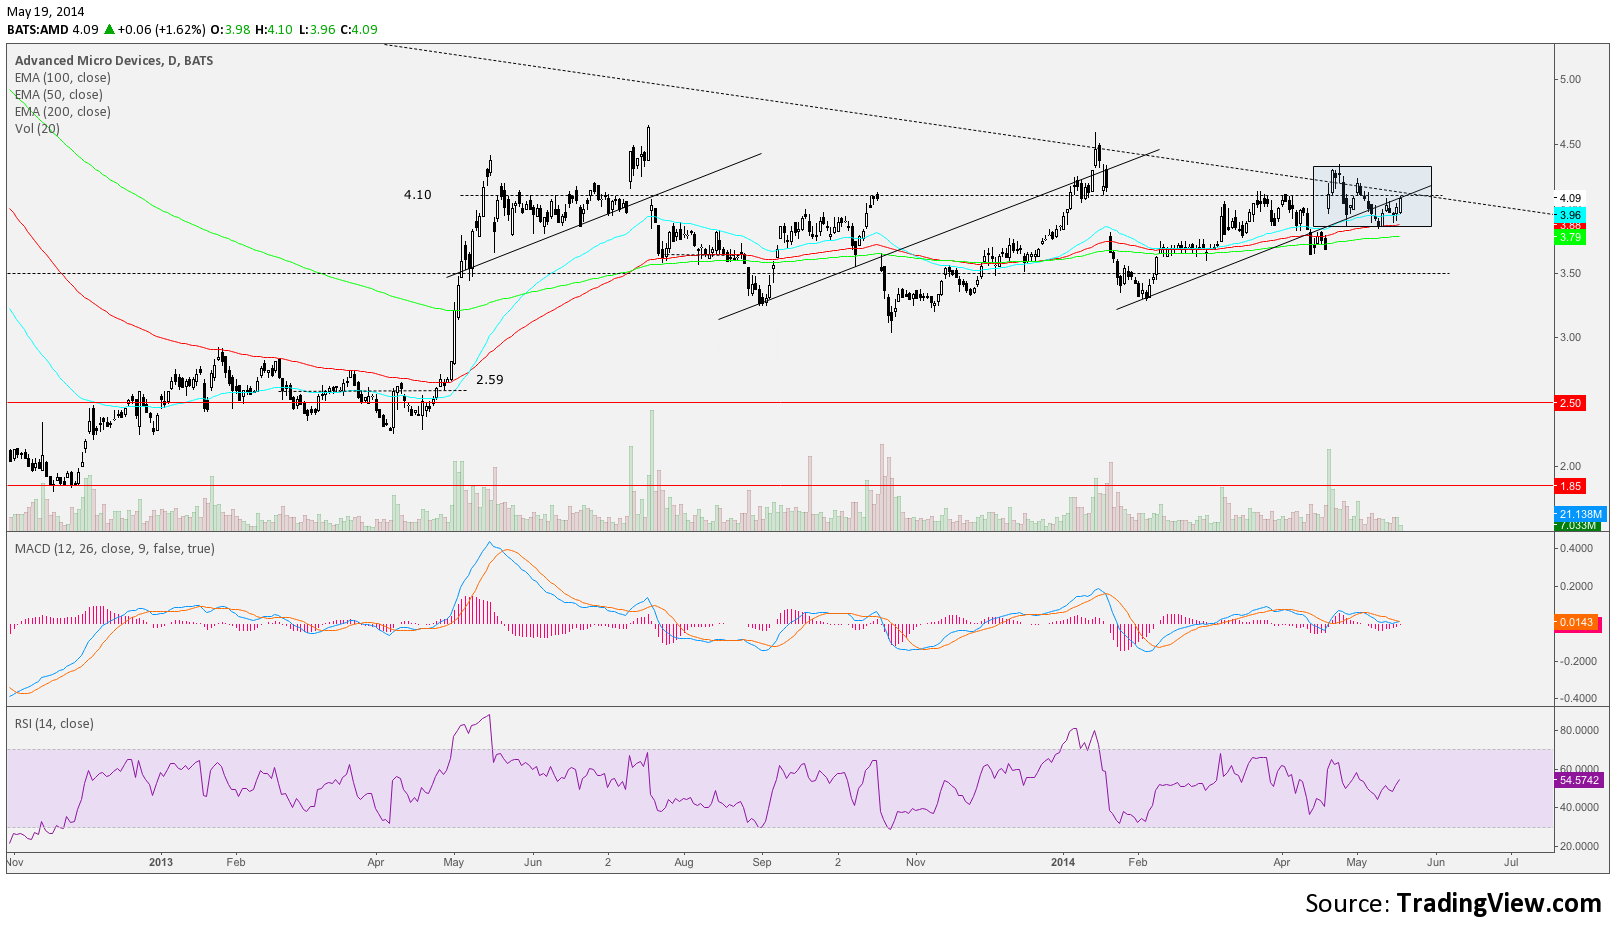
May 19, 2014 mid day look at AMD chart.

Resistance at 4.10 remained but I felt holding the gap and 100 EMA engulfing candle on 5/12 indicated strength and stock acceleration was imminent.
Added to position 5/21 daily with MACD crossing and holding positive RSI tested 50, raised stop to close below 50 EMA.
Stopped out 06/02/14 -.12


