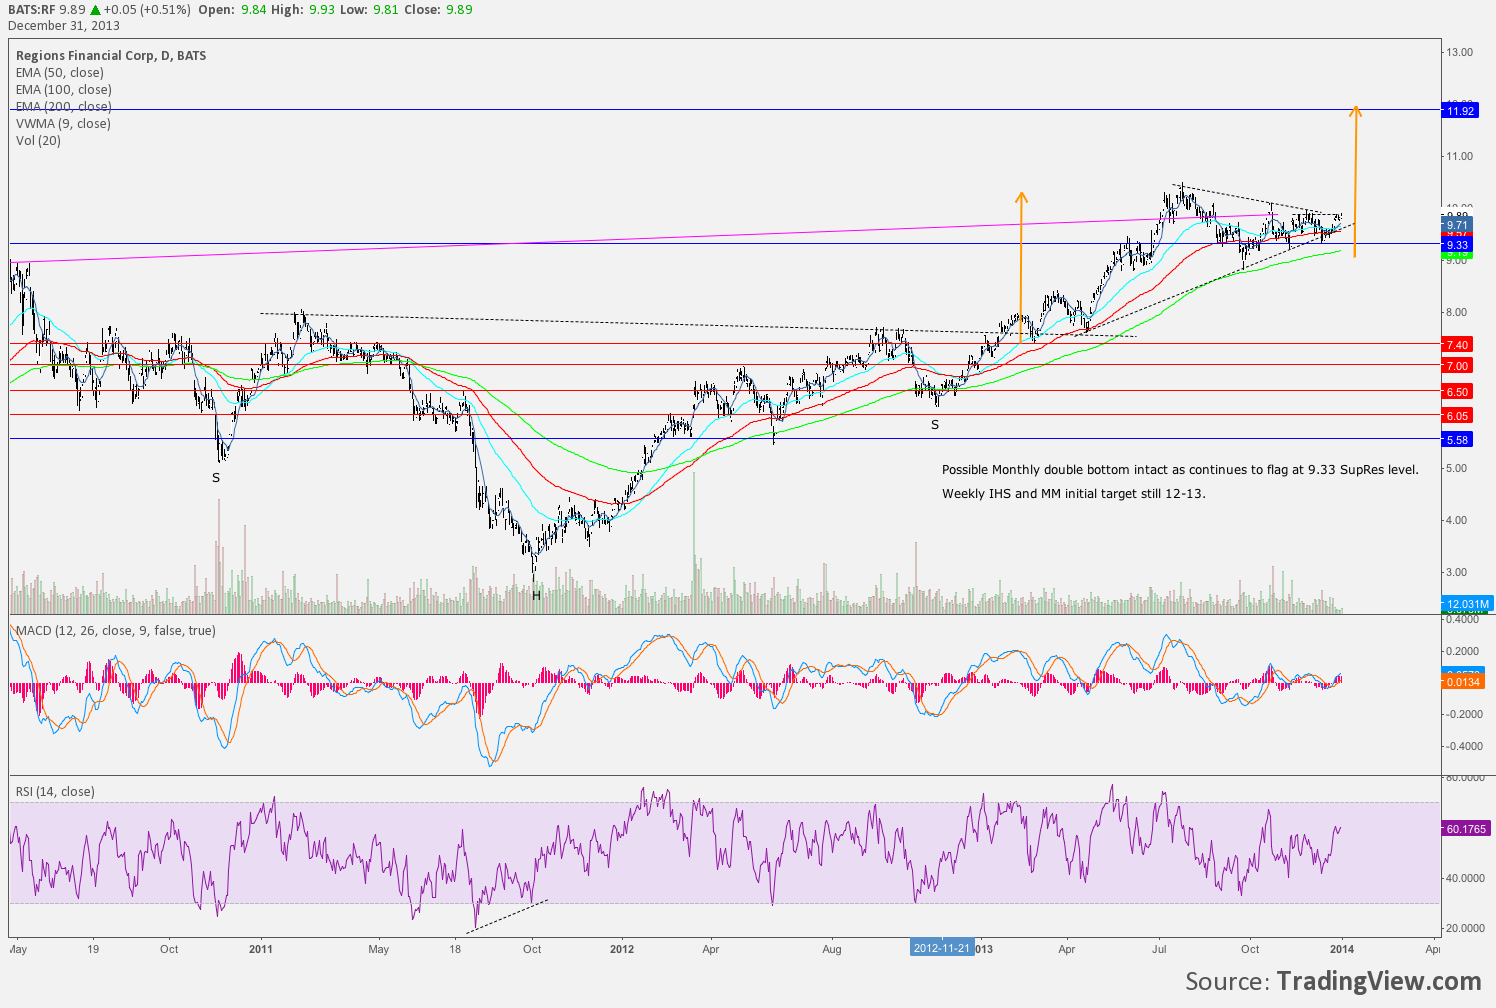
Its been a while since I charted RF. Weekly chart and thoughts from January 2013 year end chart review post below.
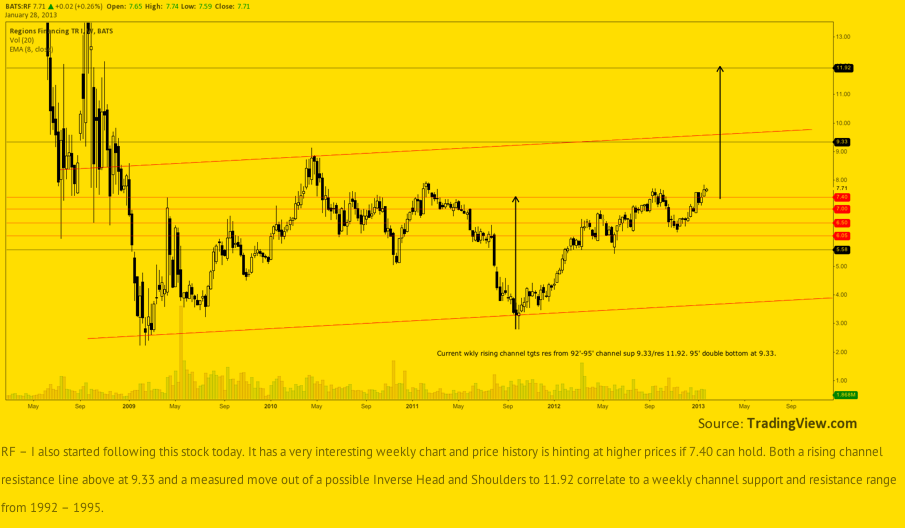
By July 2013 RF had reached an initial target at the weekly channel and support resistance level of 9.33. Mentioned here and chart below.
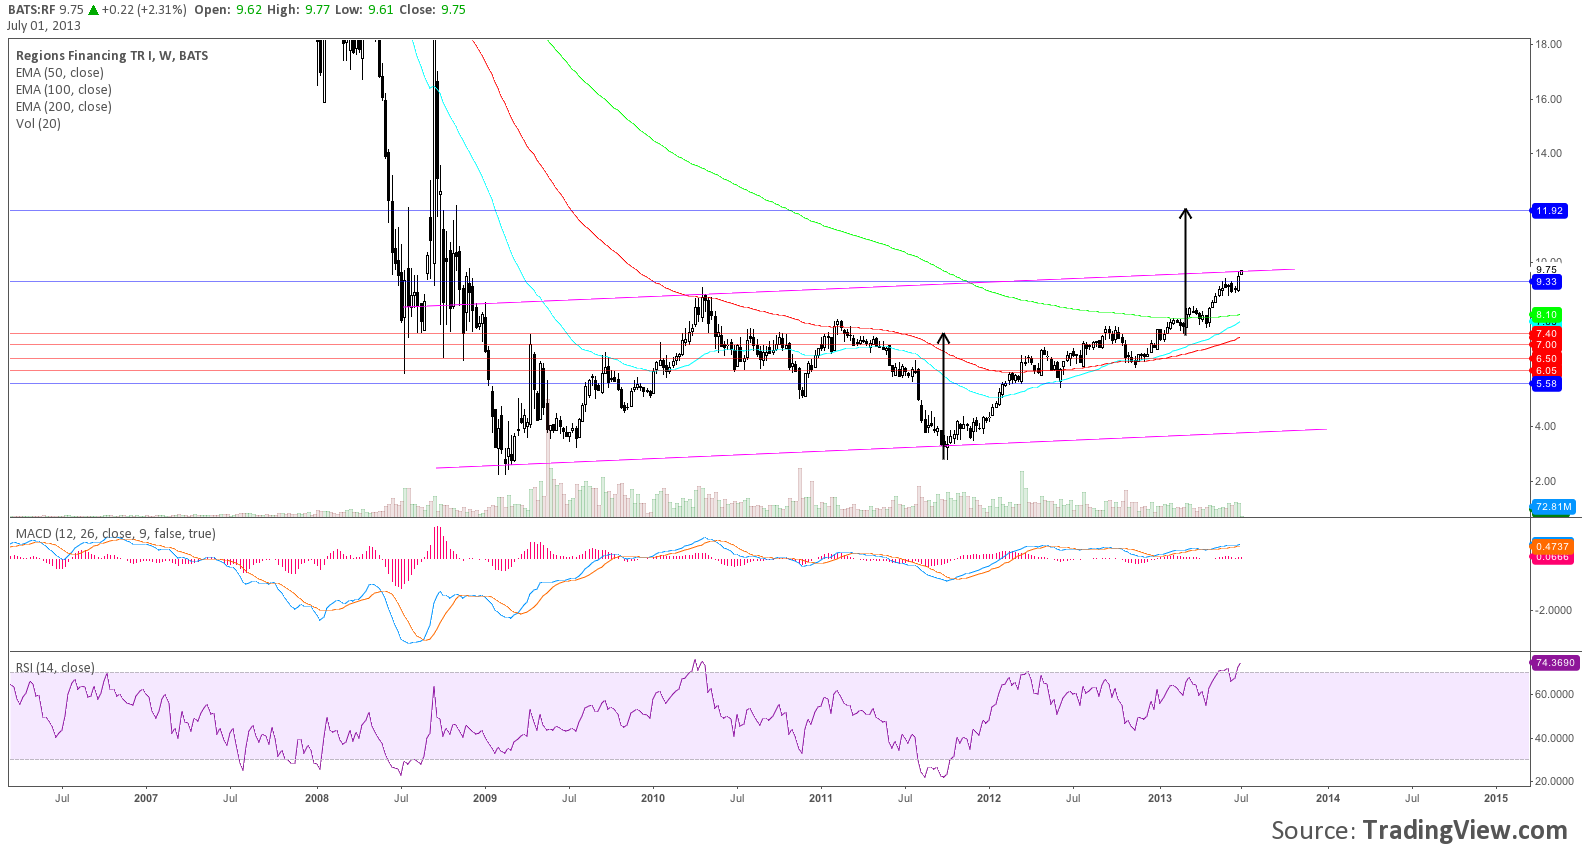
RF did not make it all the way to its next target but still did well to push through the channel and 9.33 level. In November RF was noted as consolidating the move higher in a triangle. Chart below.
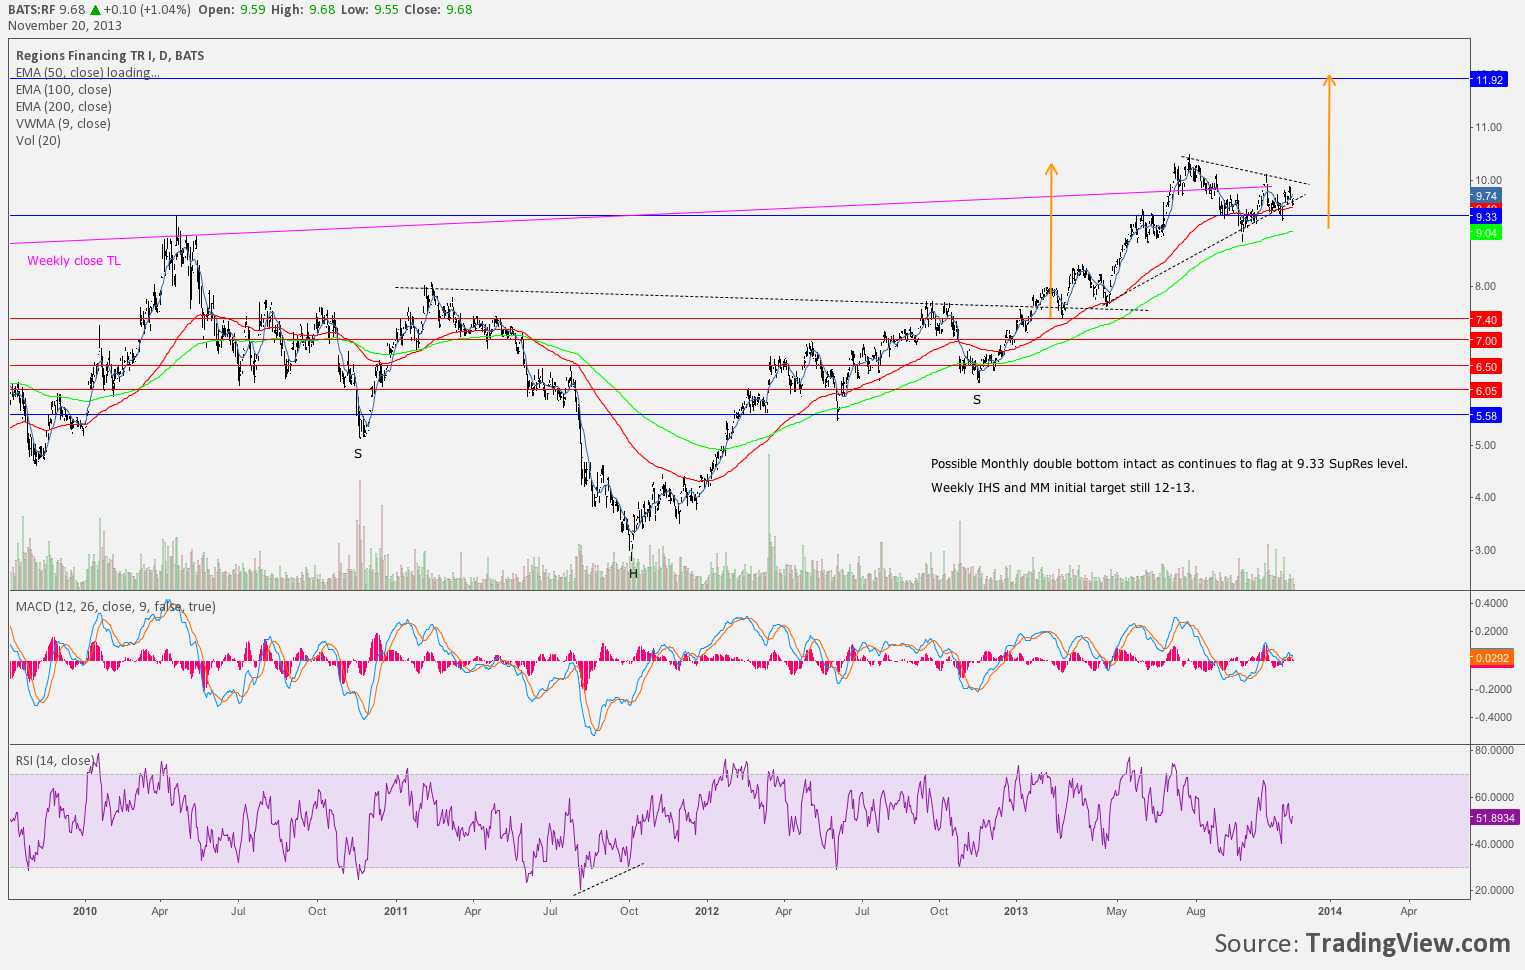
In January 2014 I reviewed RF again in the years chart review post. Quoted review on RF from that post and chart below.
“RF – Another one I had followed for a very long time. Recently took an undisclosed position at 9.52 then sold that same days close. Just didn’t like the close, scared out trying to pick a bottom. It has since run nicely and I’ve not yet gotten involved. Posted to the stream a couple times about RF potential to 12.”
I bought and sold on December 17 very near the tip triangle charted. The priors day close was negative but at the 9Vwma. A close above this MA given the technical setup and support at 9.33 would have been a buy signal. Anticipating such I took position on open. RF closed at the lows of the day below the 9Vwma. I closed the position.
On the 18th a hammer candle of sorts printed with good volume and a close above the 9Vwma. I did not get back in however and instead watched RF rally consistently to 11 dollars holding the 9Vwma without me.
This exemplifies, at least for that particular setup, the importance of closing price. I should not have anticipated and I neglected to believe in the strategy before me the very next day.
I did reenter RF later but not based on closing price.
RF had a very large volume print on January 21 of 2.4M at 10.87. I mentioned such on the 23rd as RF struggled to regain this level after slight selling.
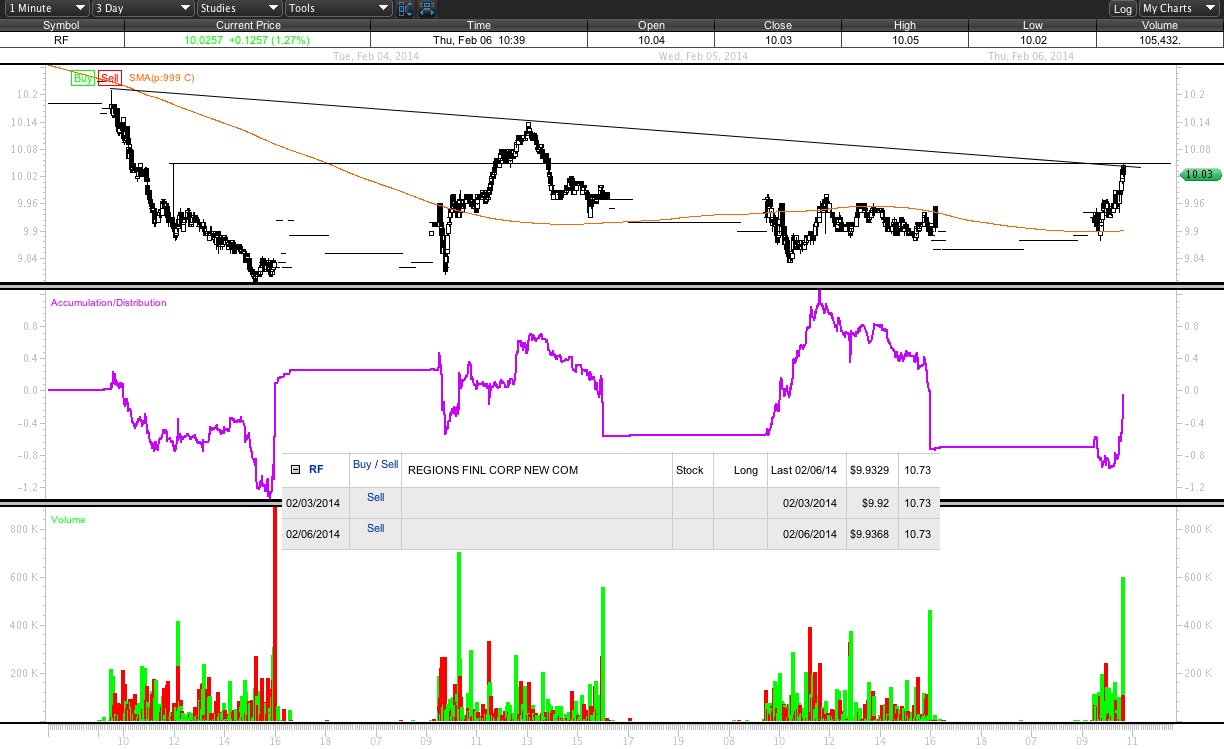
At this point I had a potential high in place and reliable support levels charted. I began monitoring prints as price came in. 1M print Jan 31 AH at 10.17 16:01:13 after a gap lower open closed near lows. Subsequent were smaller but as prints started to add up price started to flatten out at smaller time frames near possible support areas.

RF sliced through its 50% Fibonacci retracement to a low of 9.79 just above the 618. I initiated a starter position on February 3 at uptrend line anticipating lower prices into 9.33. But RF traded sideways for two days at the weekly channel holding the 100DMA and trend line at close.
On Feb 6 I purchased again as prints continued to come in with sideways action my stop was below the recent pivot lows.
A week later RF had made a nice move off the low with multiple time frame setups developing.
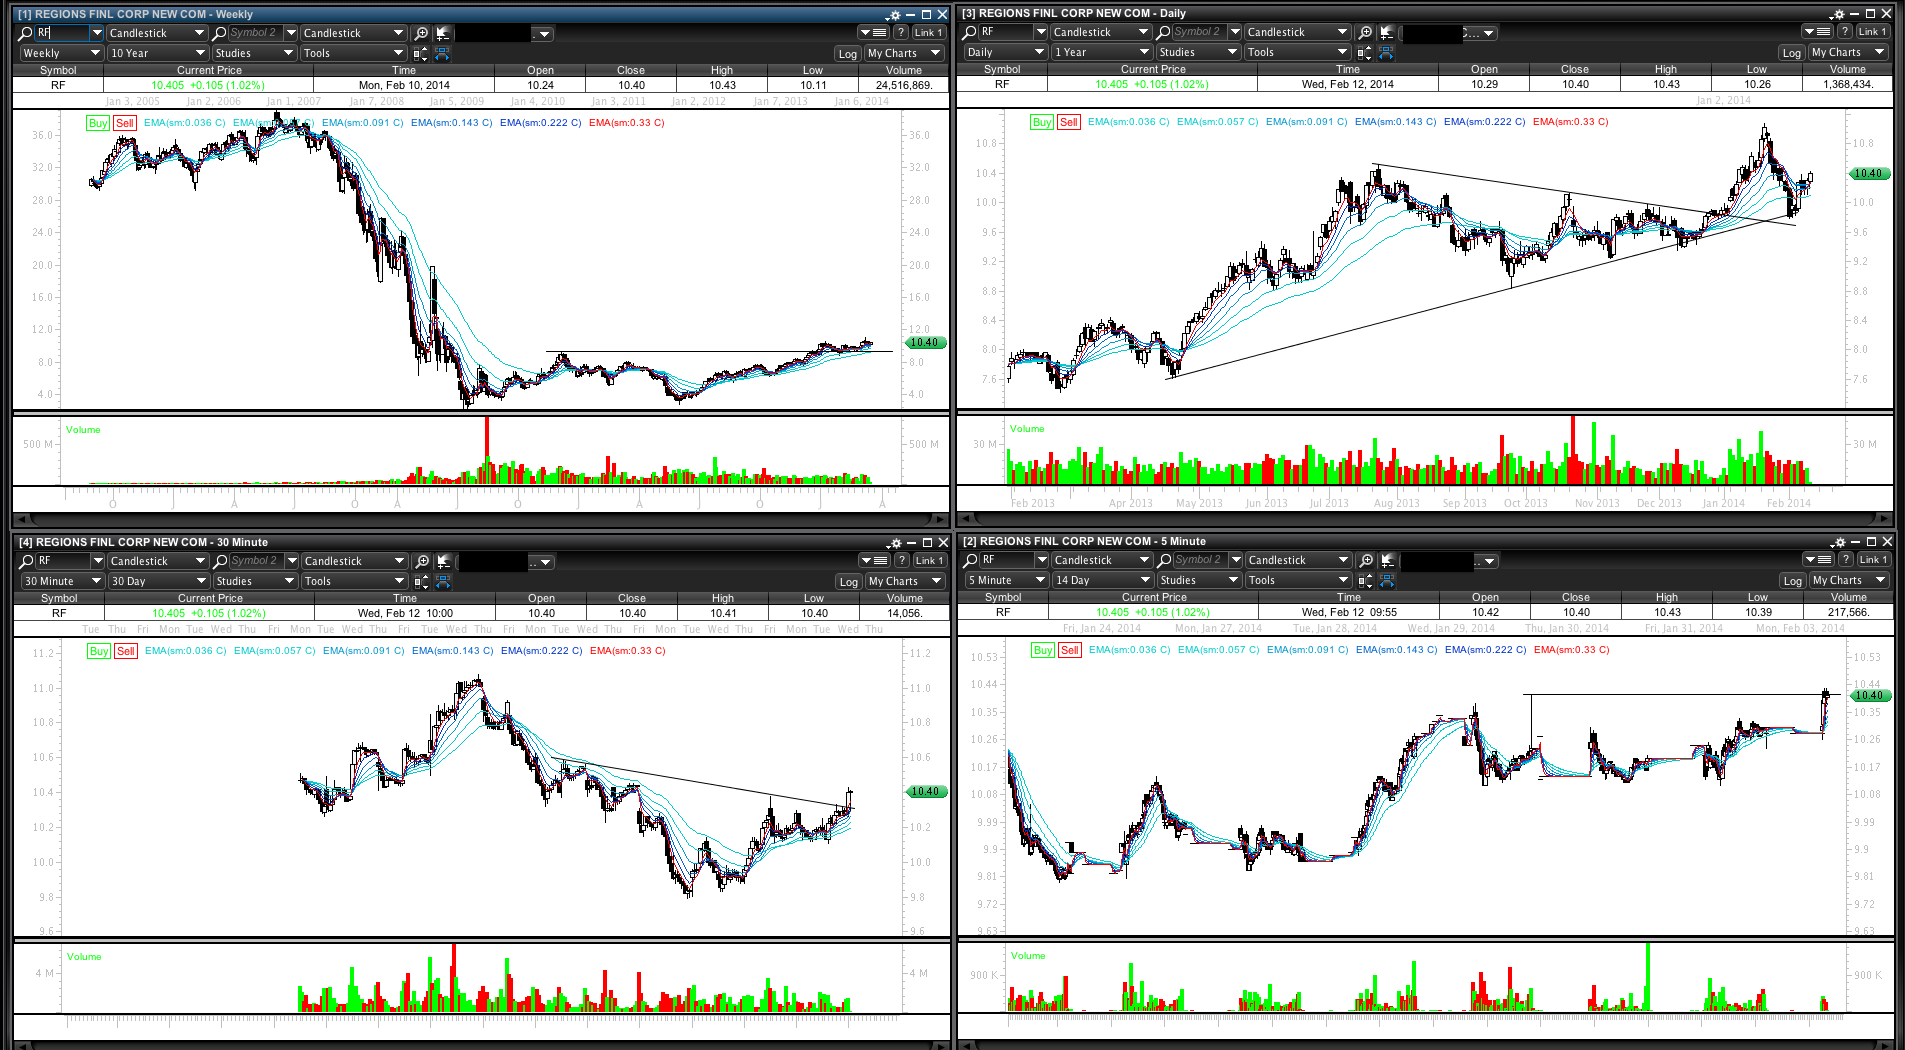
At this point, March 6, sentiment continues to be very skeptical of financials weakness vs market strength.
The monthly chart of RF shows that a very large volume shelf is being attacked by bulls. If the 10.55 – 11.00 range is taken out and acts as support there is very little resistance to measured moves taking RF 14.50 – 18.00. Screen grab below taken Feb 13.
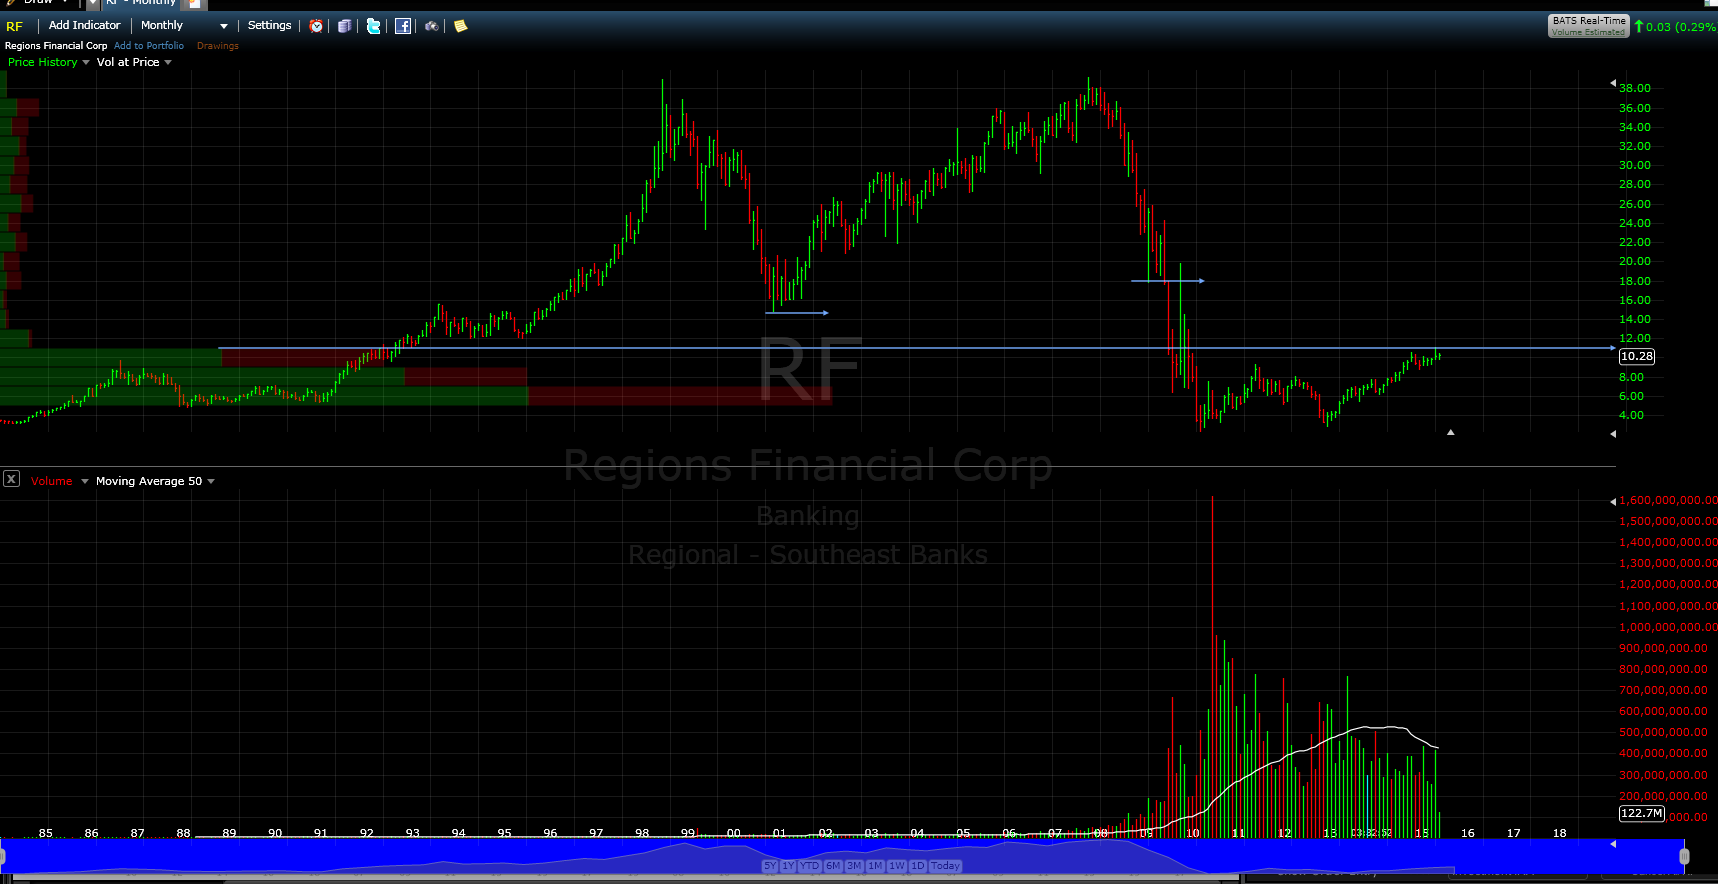
Interesting enough RF posted 1.7M exchanged 03/05 10.73 – 10.77 before a high of 10.87. And now 383K 10.81 03/06 and 414 AH 03/06 with a high of 10.91. Thats roughly 2.4M give or take all the other sizable prints below 100K.
I will update the trade in the comments or an additional post when I exit.
As well I’ve charted KRE and XLF through February which I review in this post.

