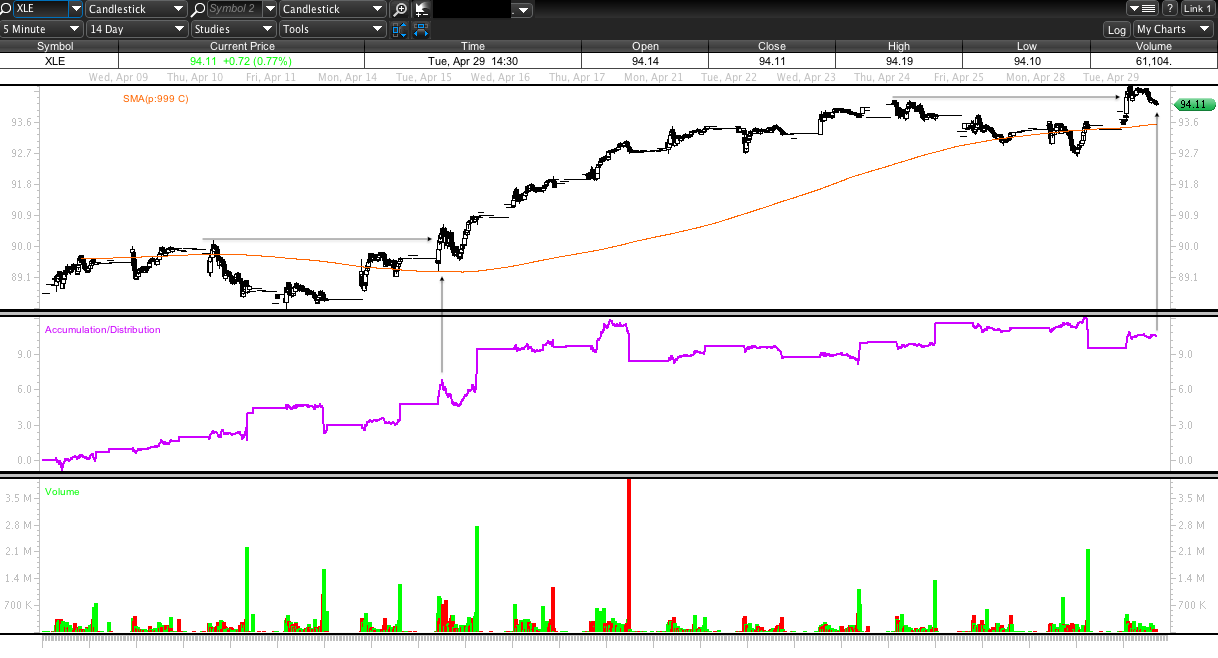
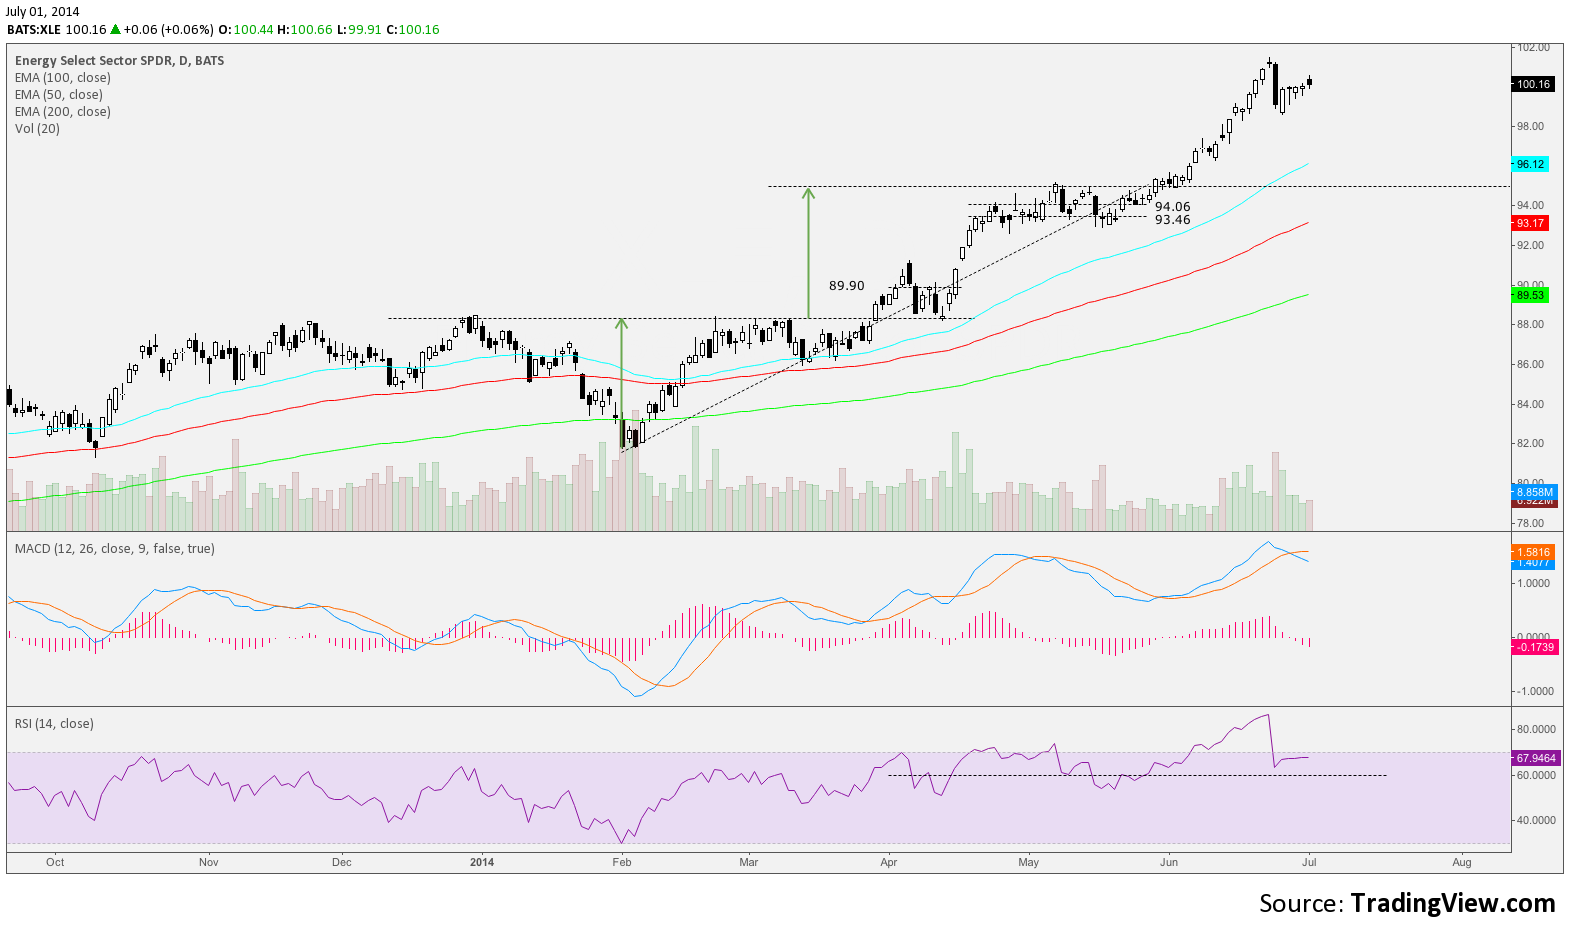
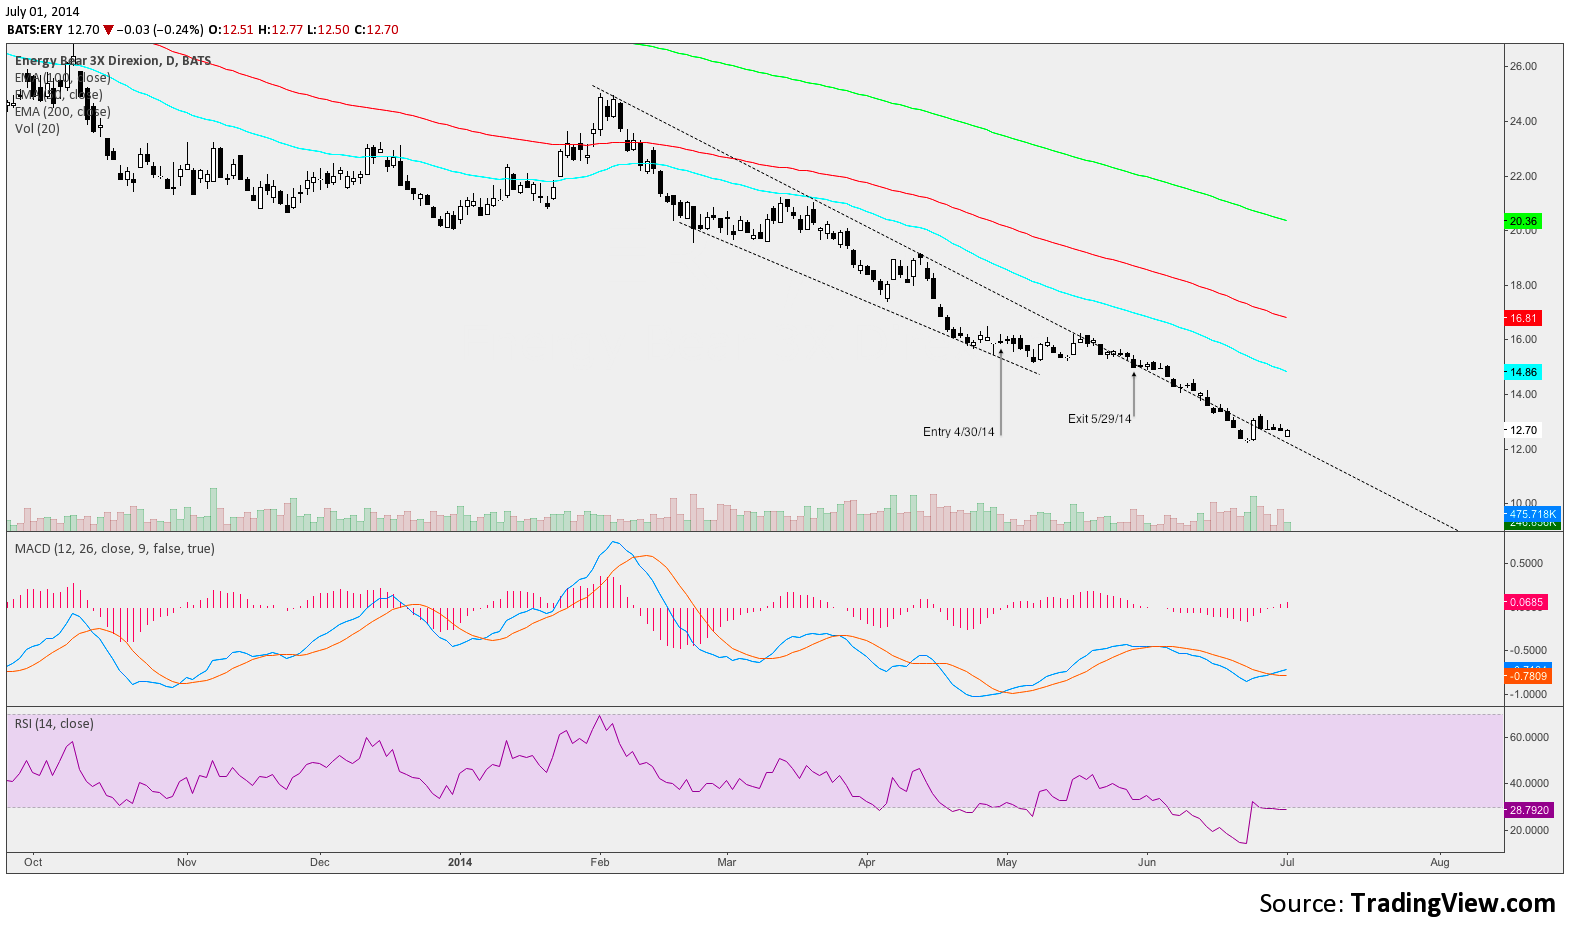
Charting some intermediate levels on the XLE looking for possible resistance near targeted MM higher, bought ERY 4/30 after doji gravestone candle failed hold new highs 4/29.
There was a small divergence at the 5min XLE to this failed new high 4/29.
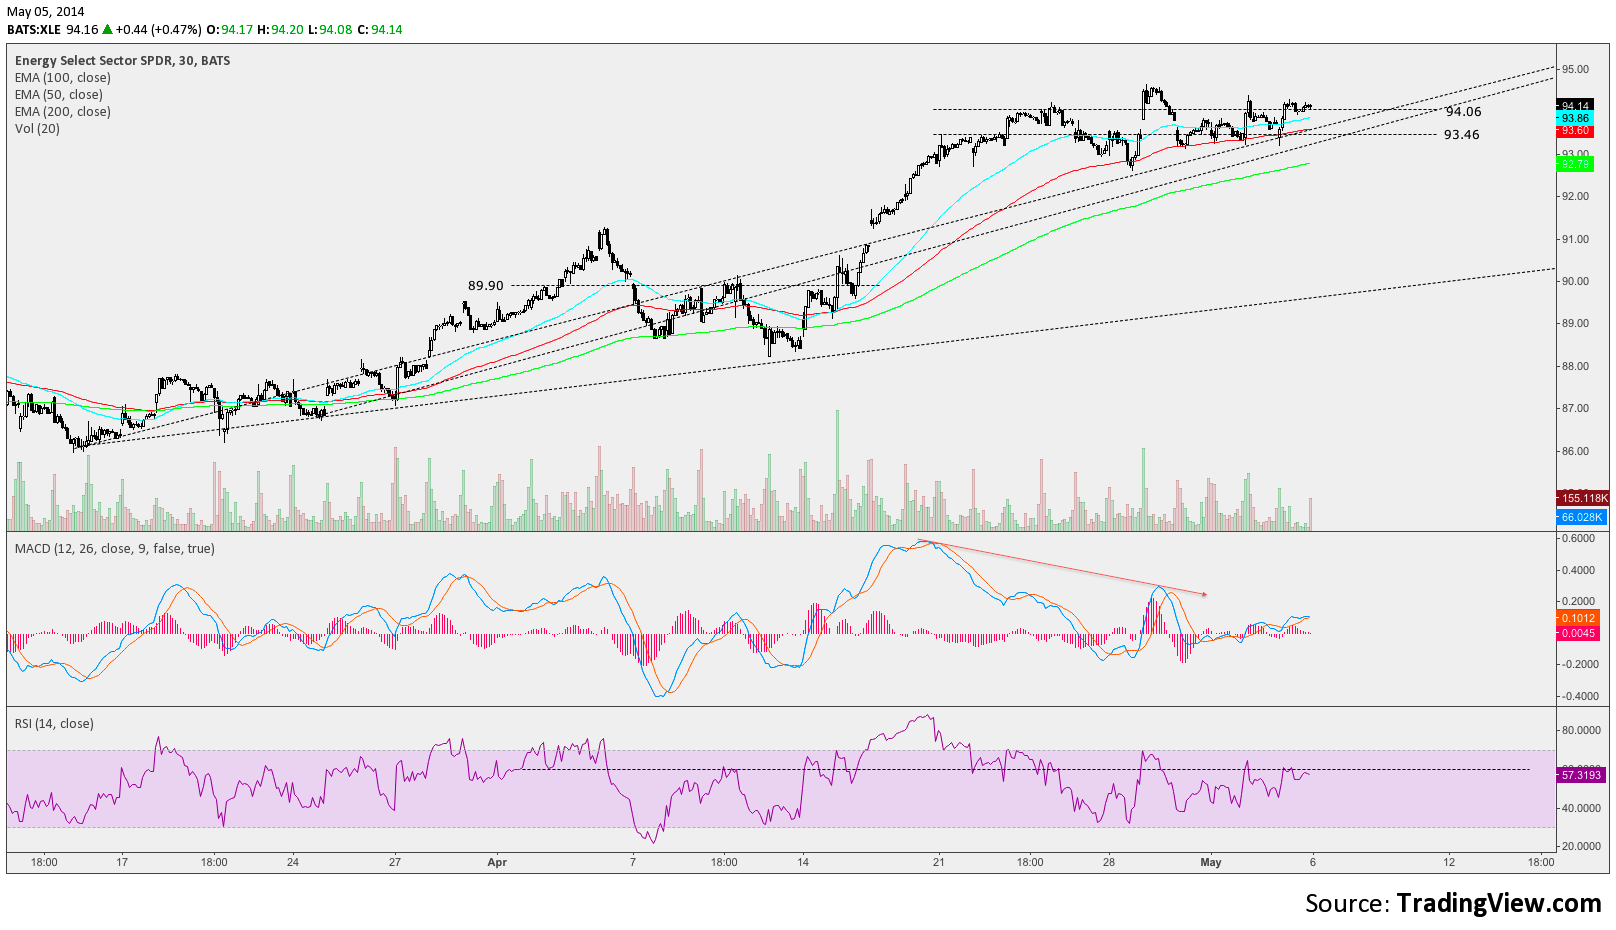
But more pronounced divergence developing in the 30min MACD seen 5/05 with RSI resistance at 60.
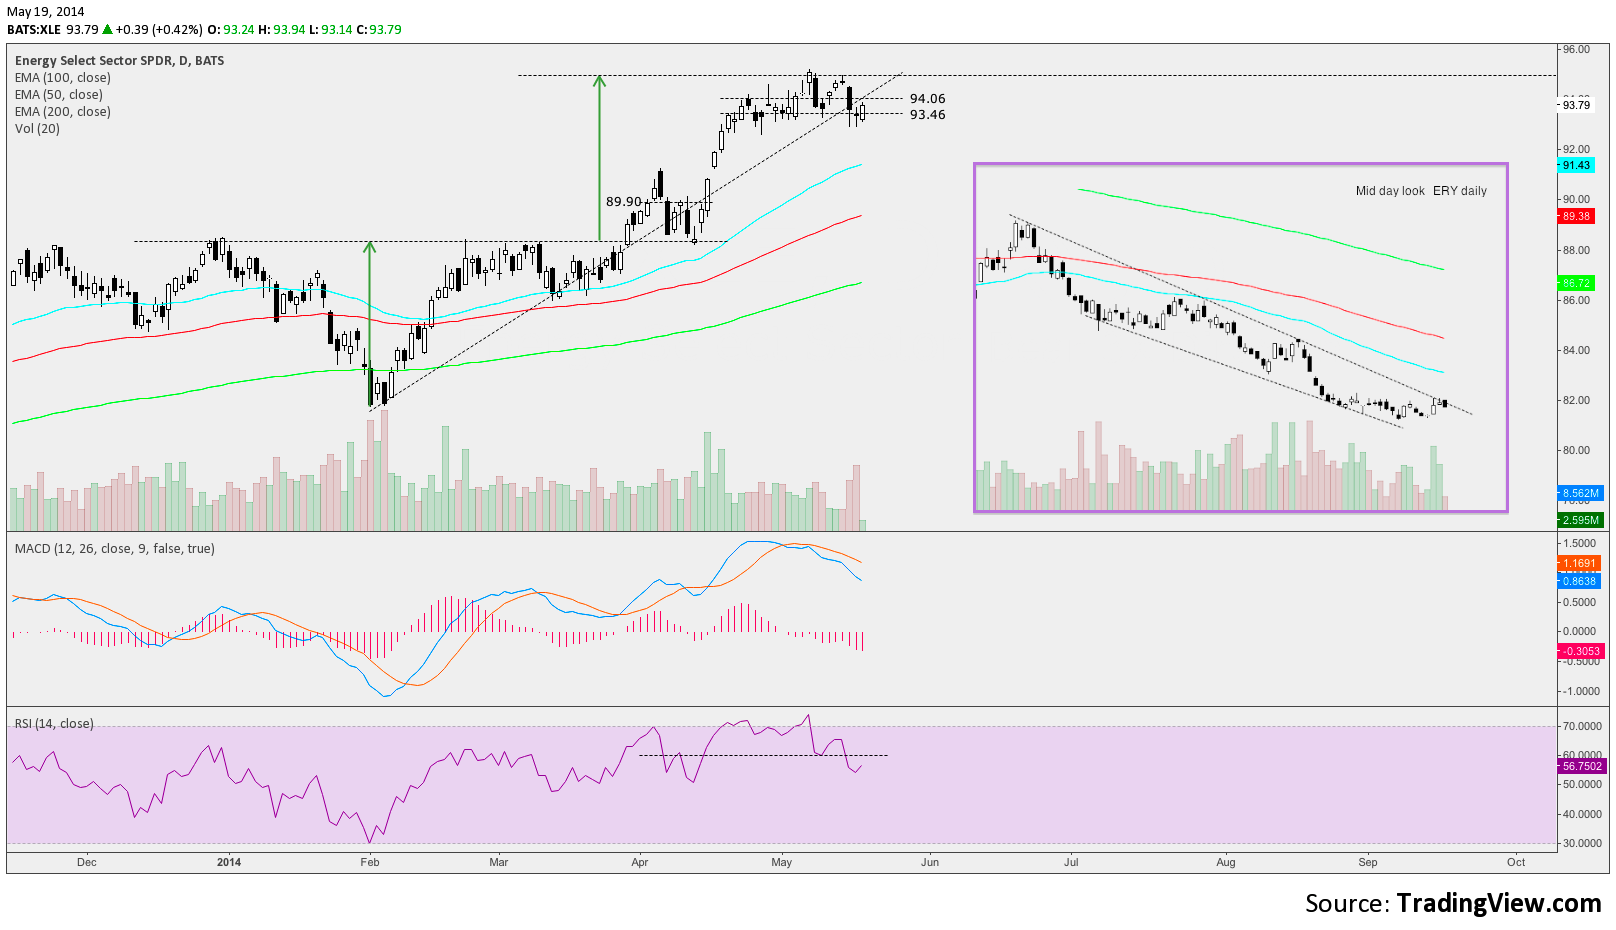
After a strong close at the daily MM target XLE sold off hard. A retest of the MM target was also sold with MACD signal crossing and RSI falling below 60 on 05/19 daily mid day look below. Also a look at the potential for falling wedge breakout in ERY remained highlighted within chart.
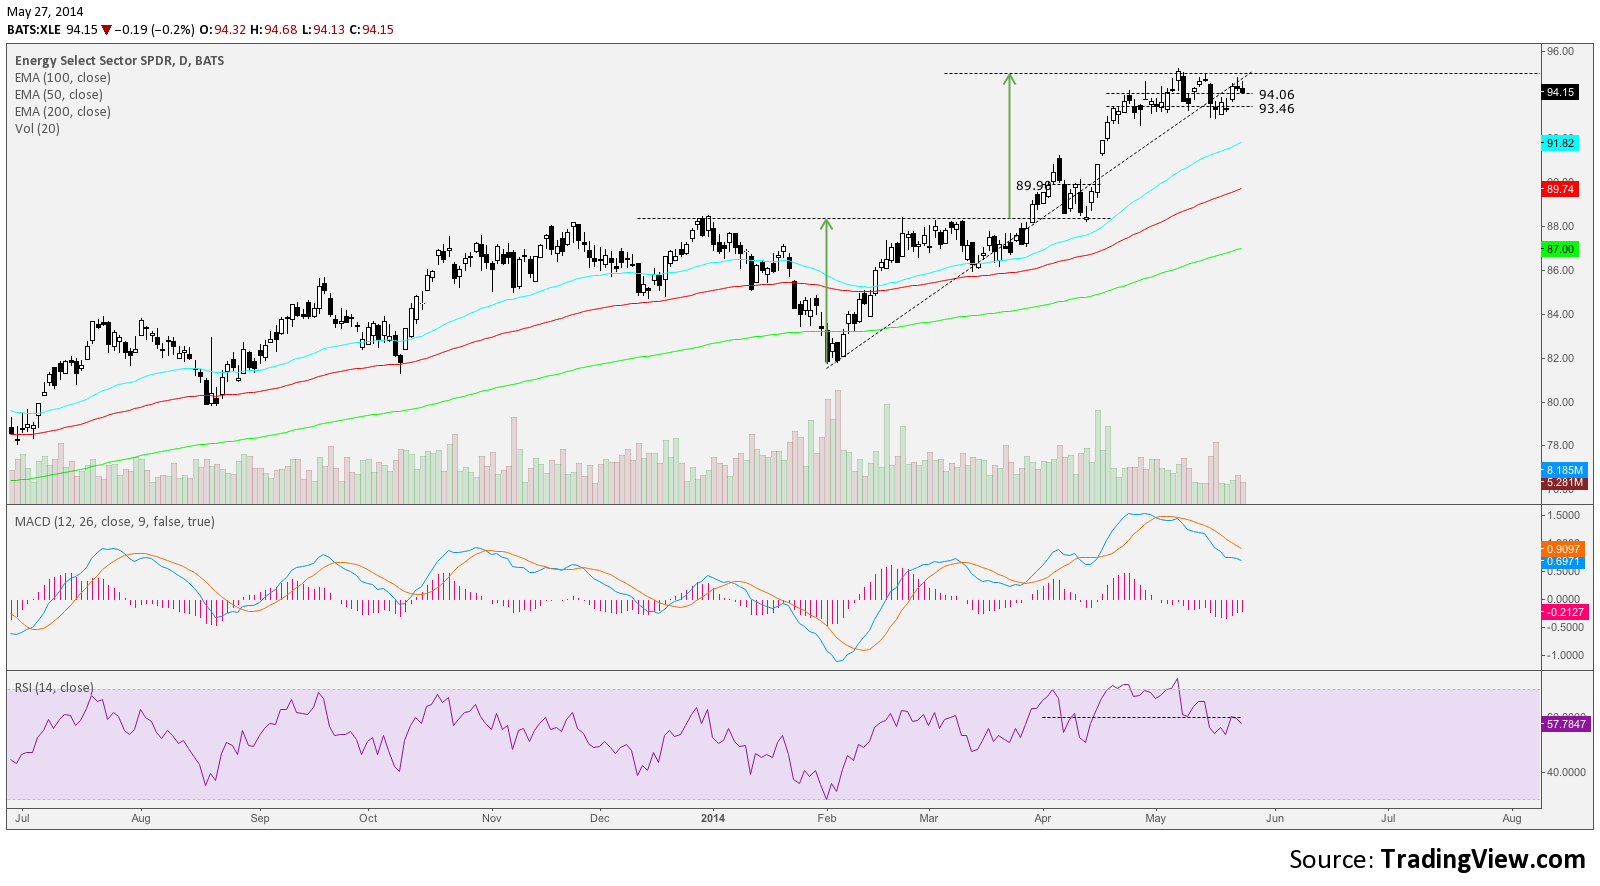
05/27 Daily resistance at TL, MM and intermediate support resistance levels were active.
Stopped out 05/29/14 with a close above MM target and prior resistance -1.00
July 1 daily close XLE chart below.
July 1 daily close ERY chart below


