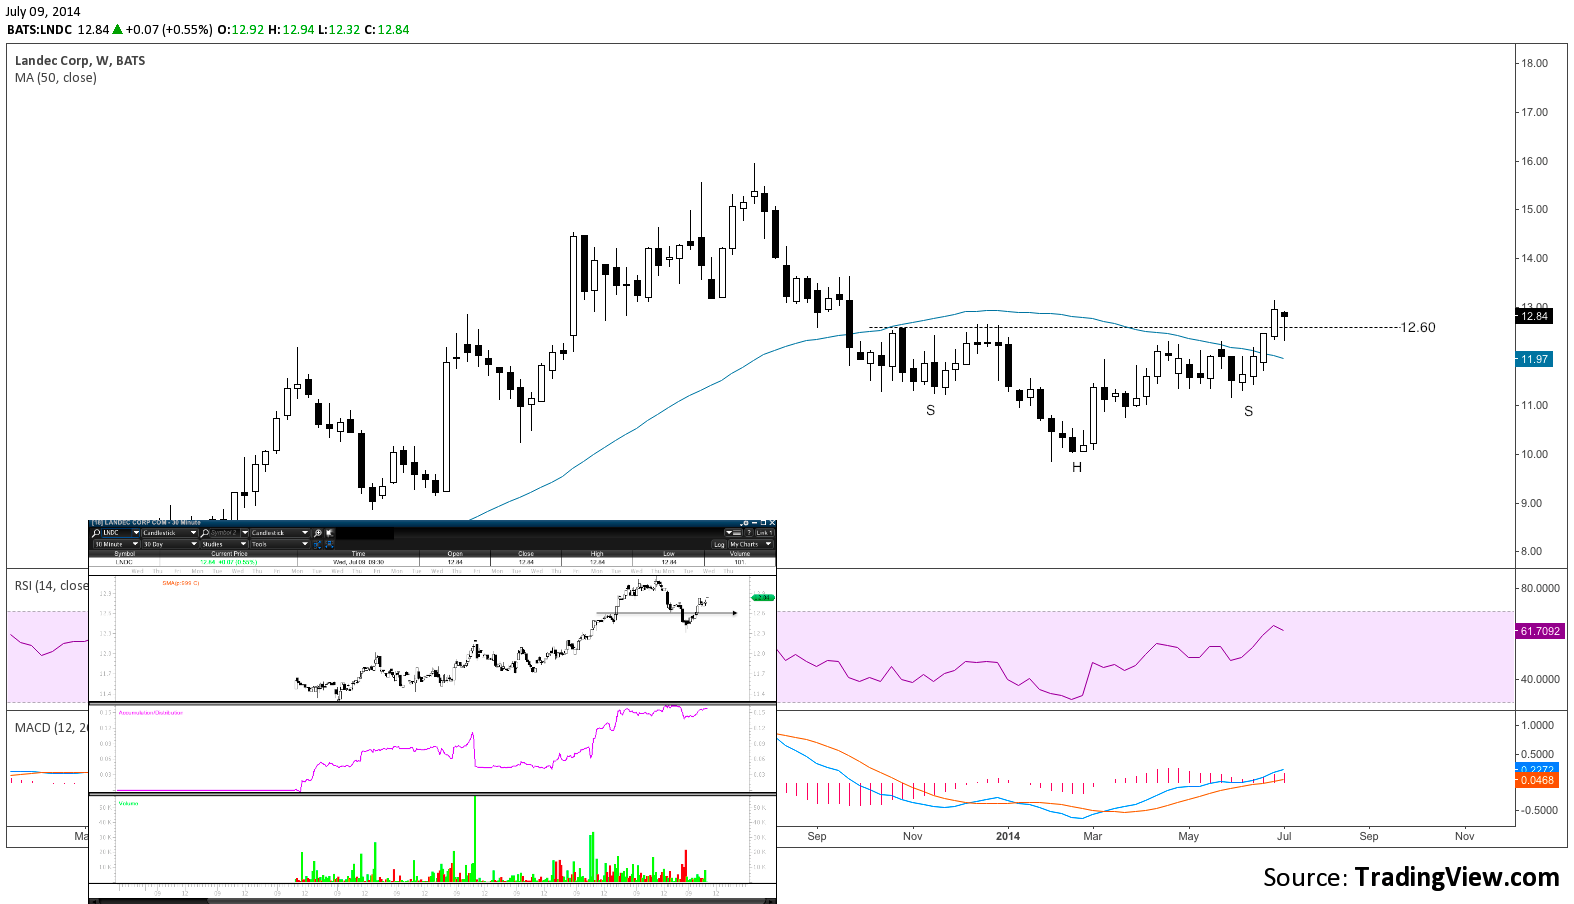
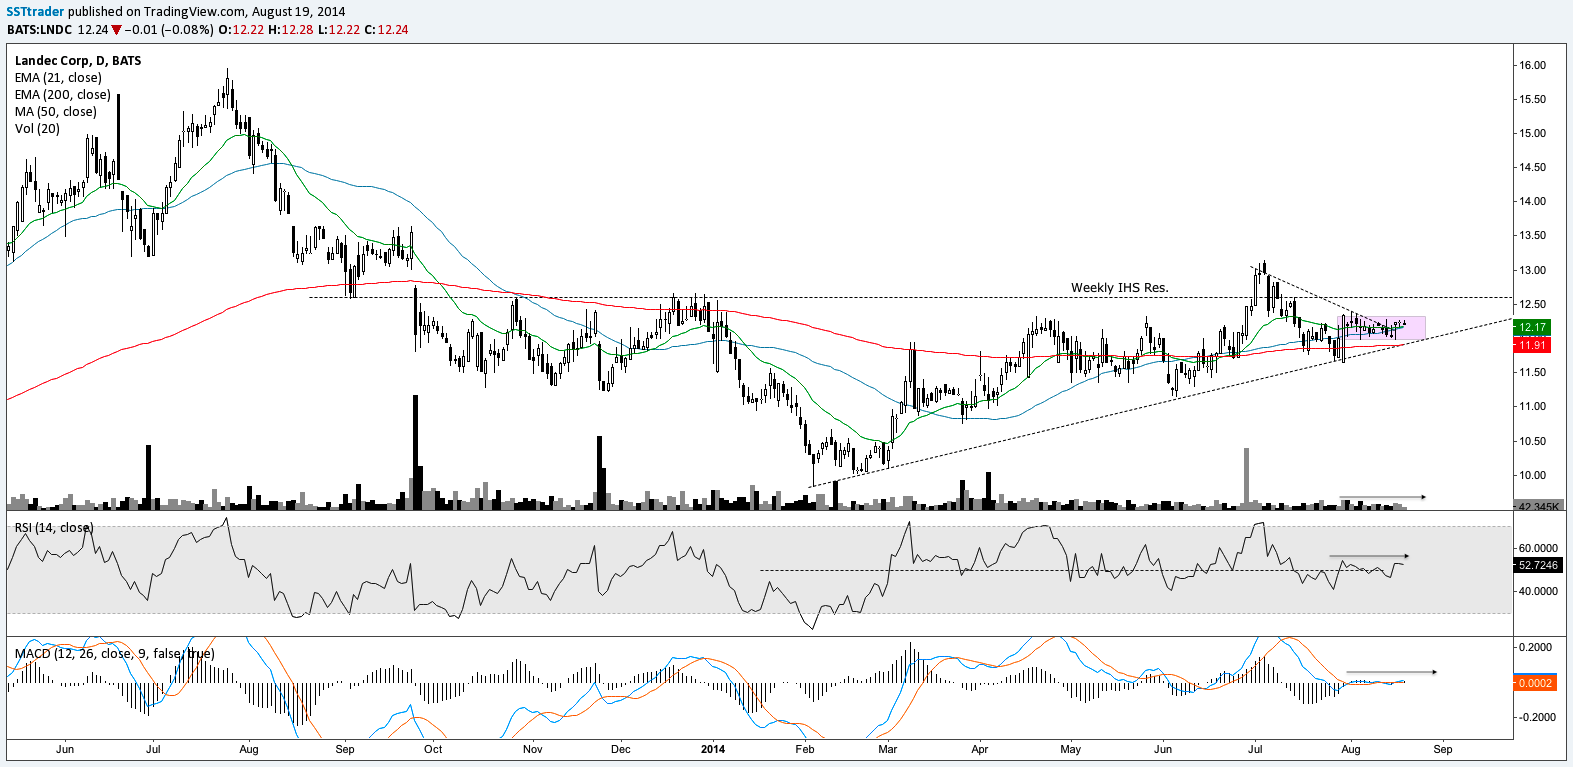
On July 9 LNDC weekly support resistance was noted on the open for potential continuation of IHS pattern.
Ultimately the 12.60 level remained resistance and LNDC pulled back to its 200 DMA and rising trend line support.
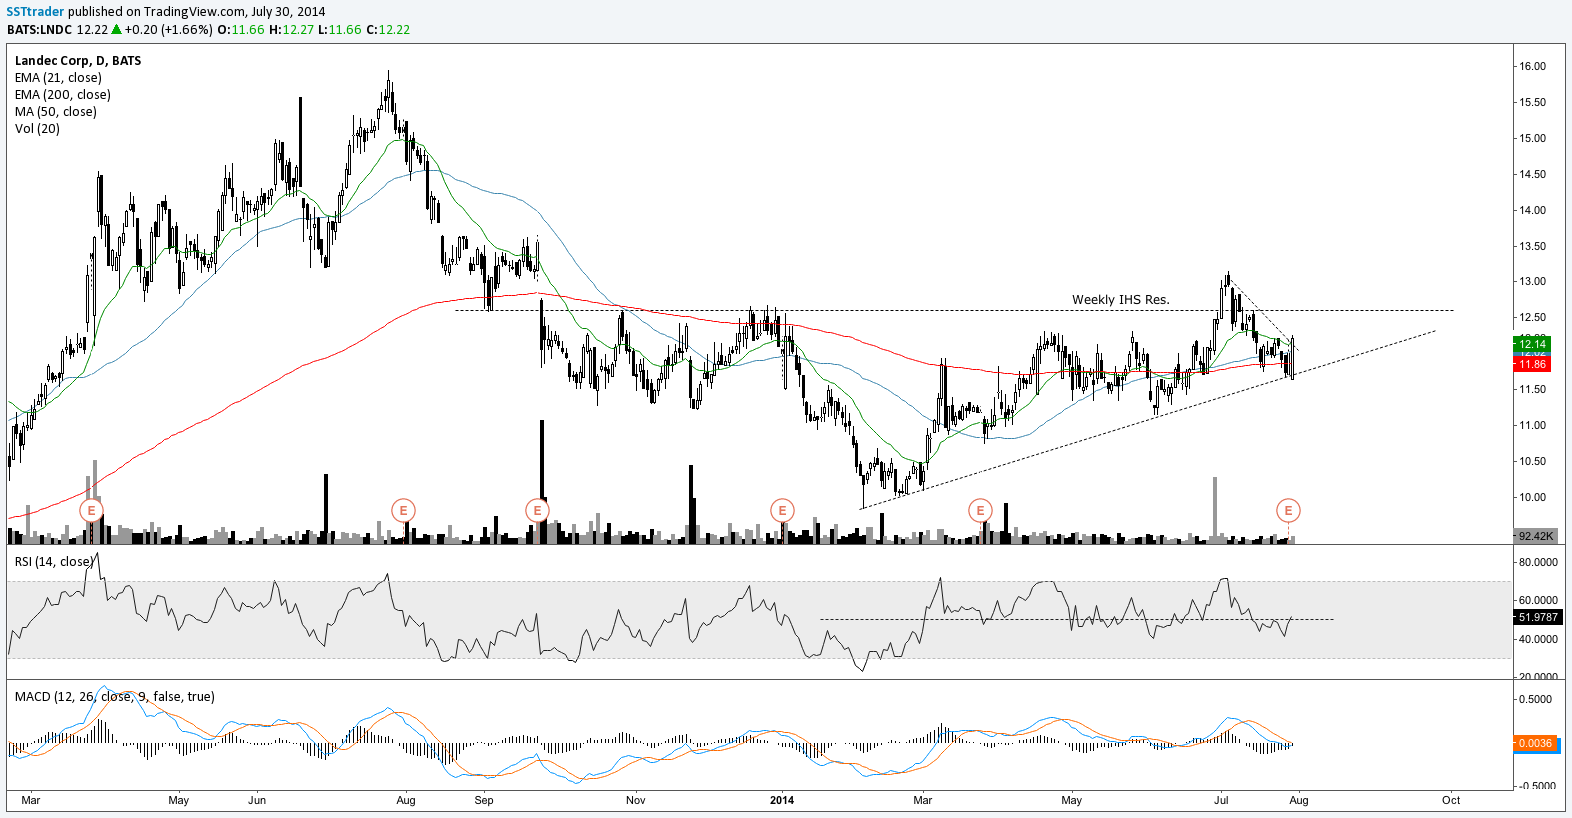
On July 29 and July 30 LNDC printed reversal engulfing candles off trend line support closing above MAs. Noted July 30 daily close below.
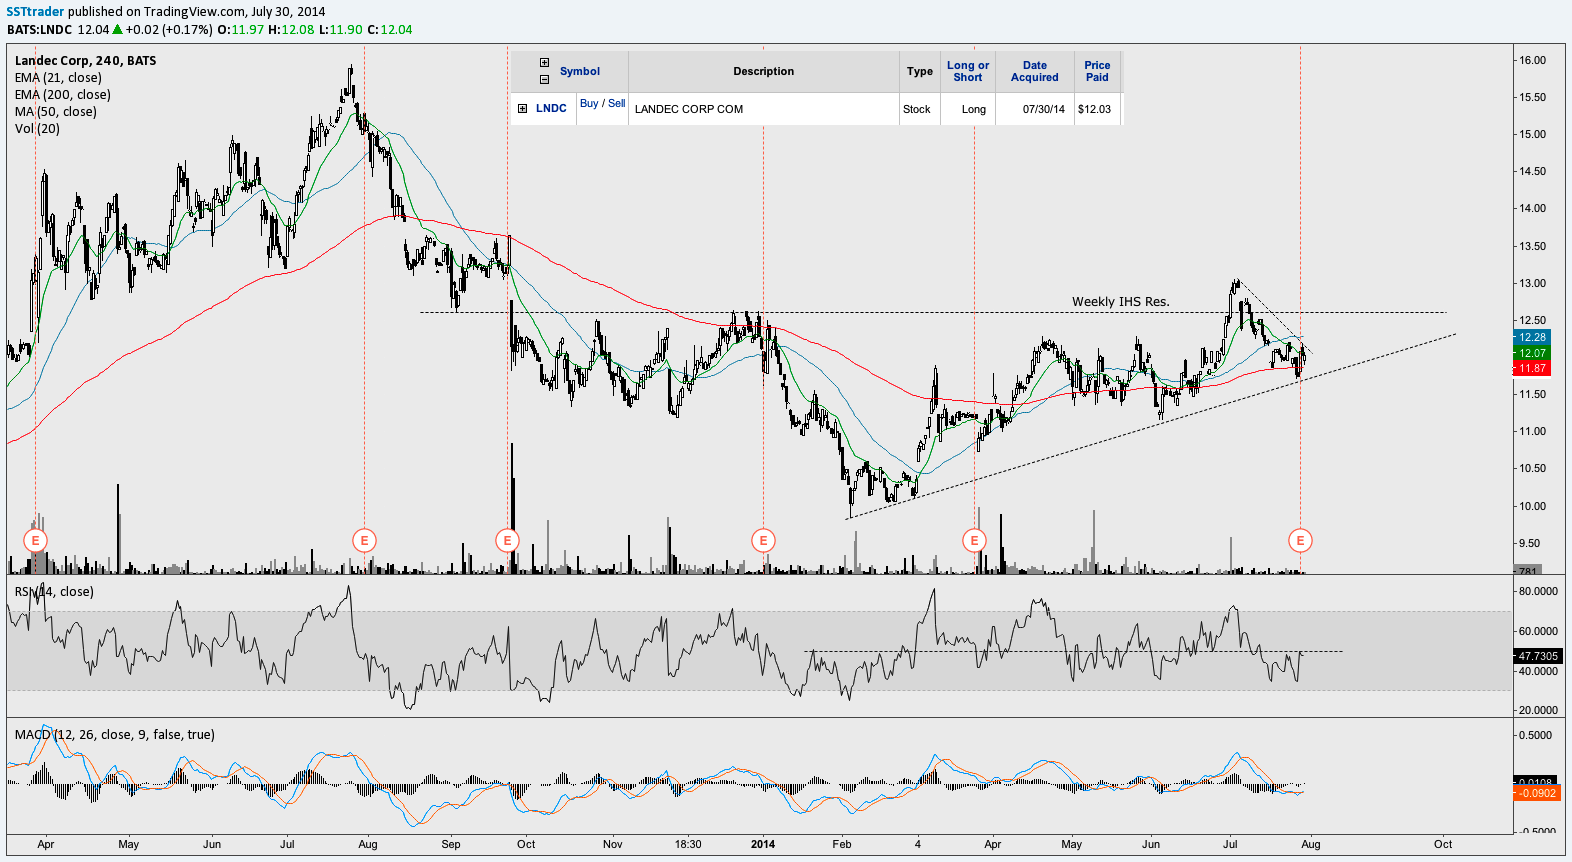
A trade was entered 12.03 on July 30. The 4hr chart below shows MACD and RSI against resistance with MACD signal crossing as price looks to test possible flag / TL breakout.
LNDC has continued to hold the top half of July 30 engulfing candle but MAs MACD and RSI have remained flat vs this initial bullish price action off support.
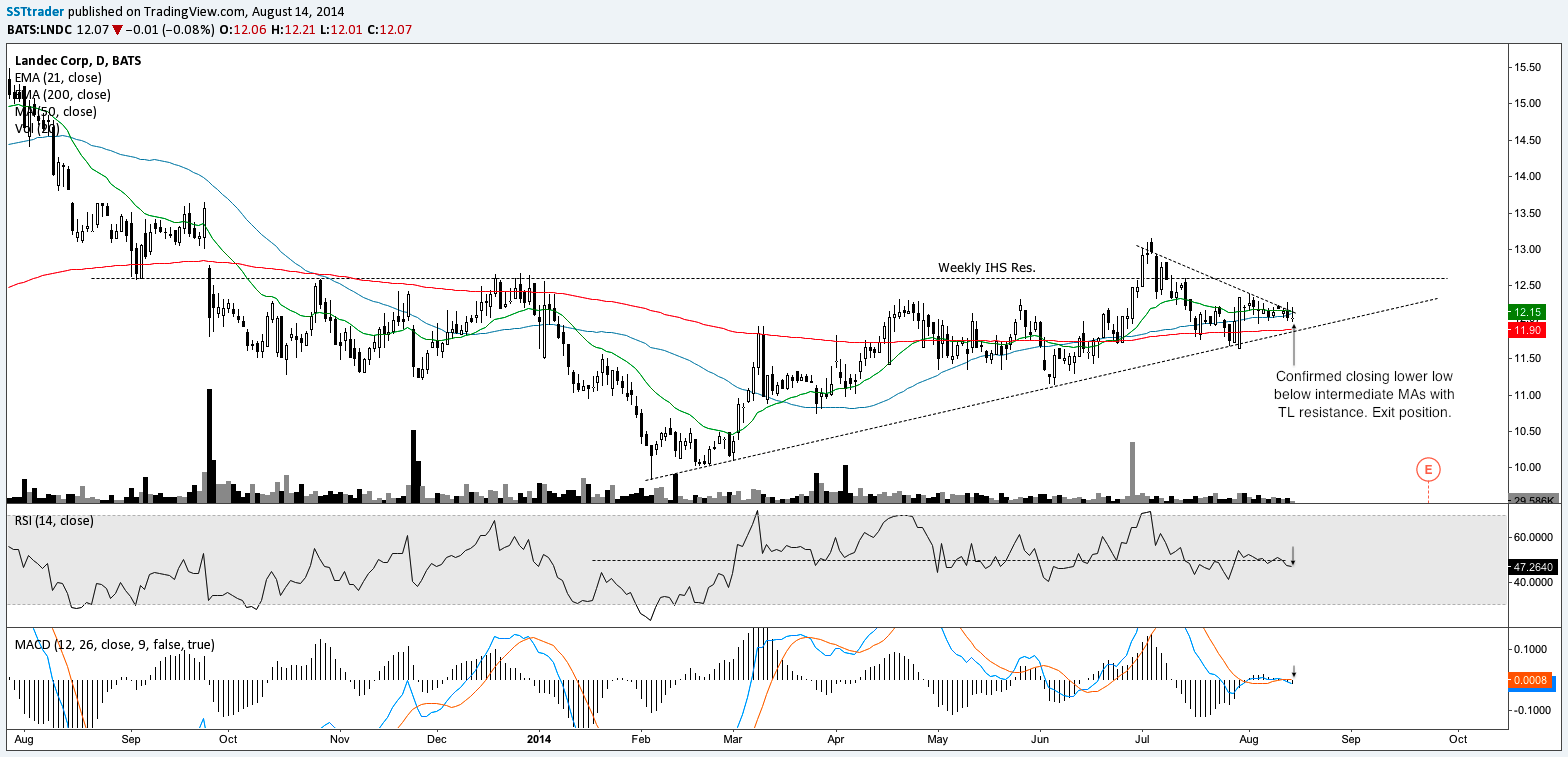
LNDC was sold on 8/14/14 at 12.00 for -.03$ With no momentum at this time and a confirmed lower close below intermediate moving averages on this day I decided to step aside and wait again for price to challenge 12.60 instead of keeping the position open with a stop below the 30th low.
LNDC has since made a new low in this consolidation but closed higher printing a hammer and is again/still flagging below resistance with flat to rising MAs. Waiting for a high volume day through intermediate resistance may be a good signal to zero in again.
Daily close Aug 19 below shows sideways action.

