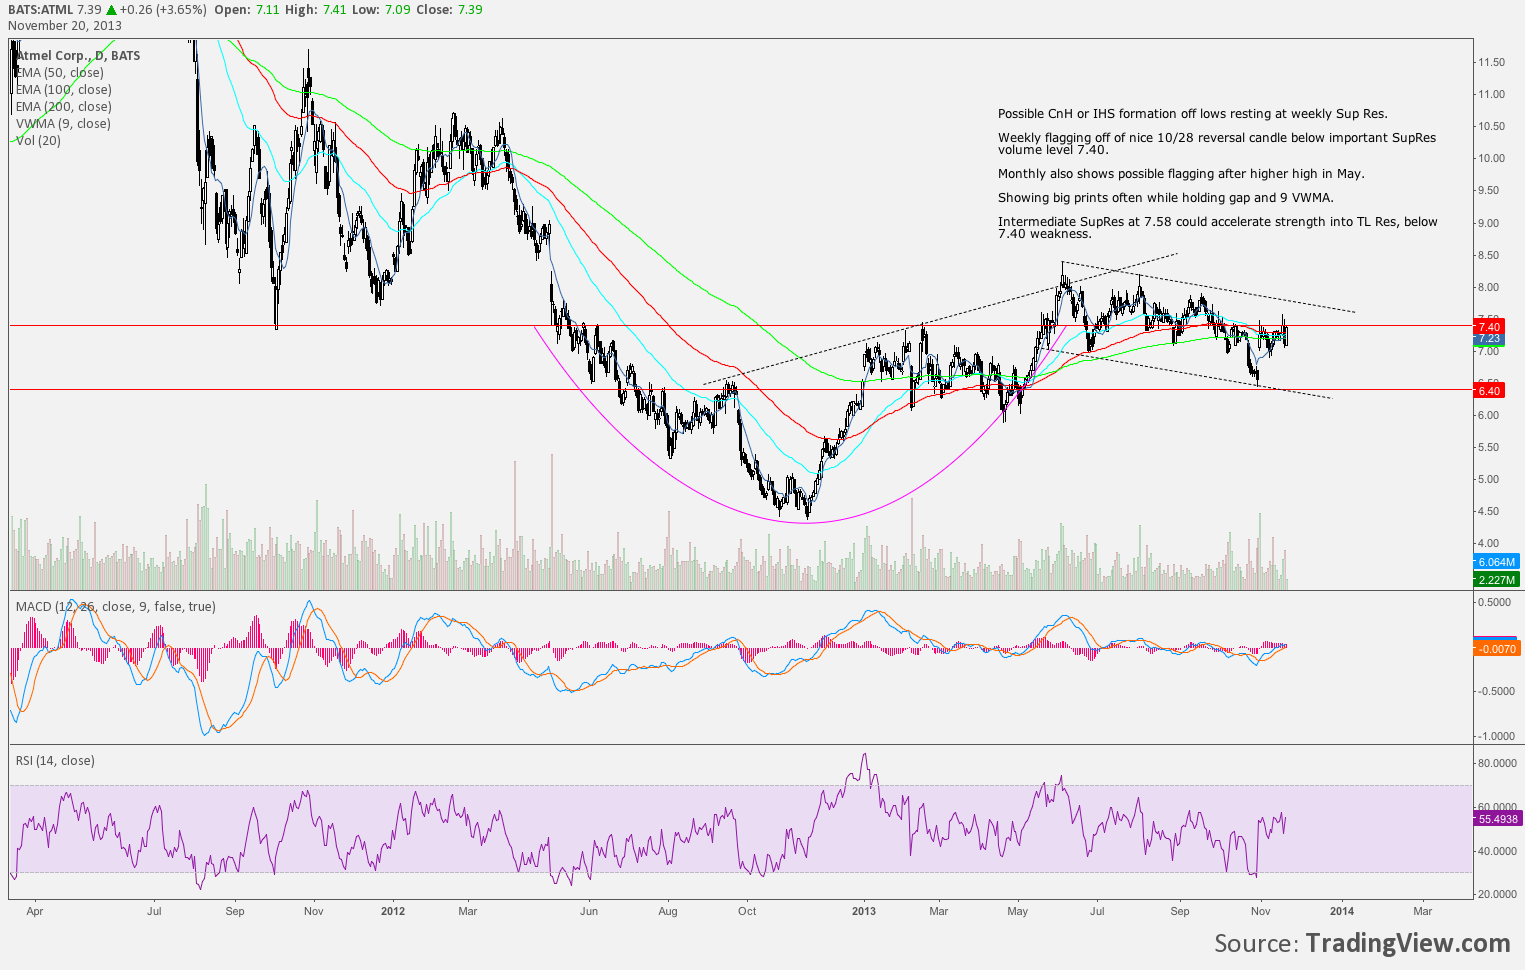
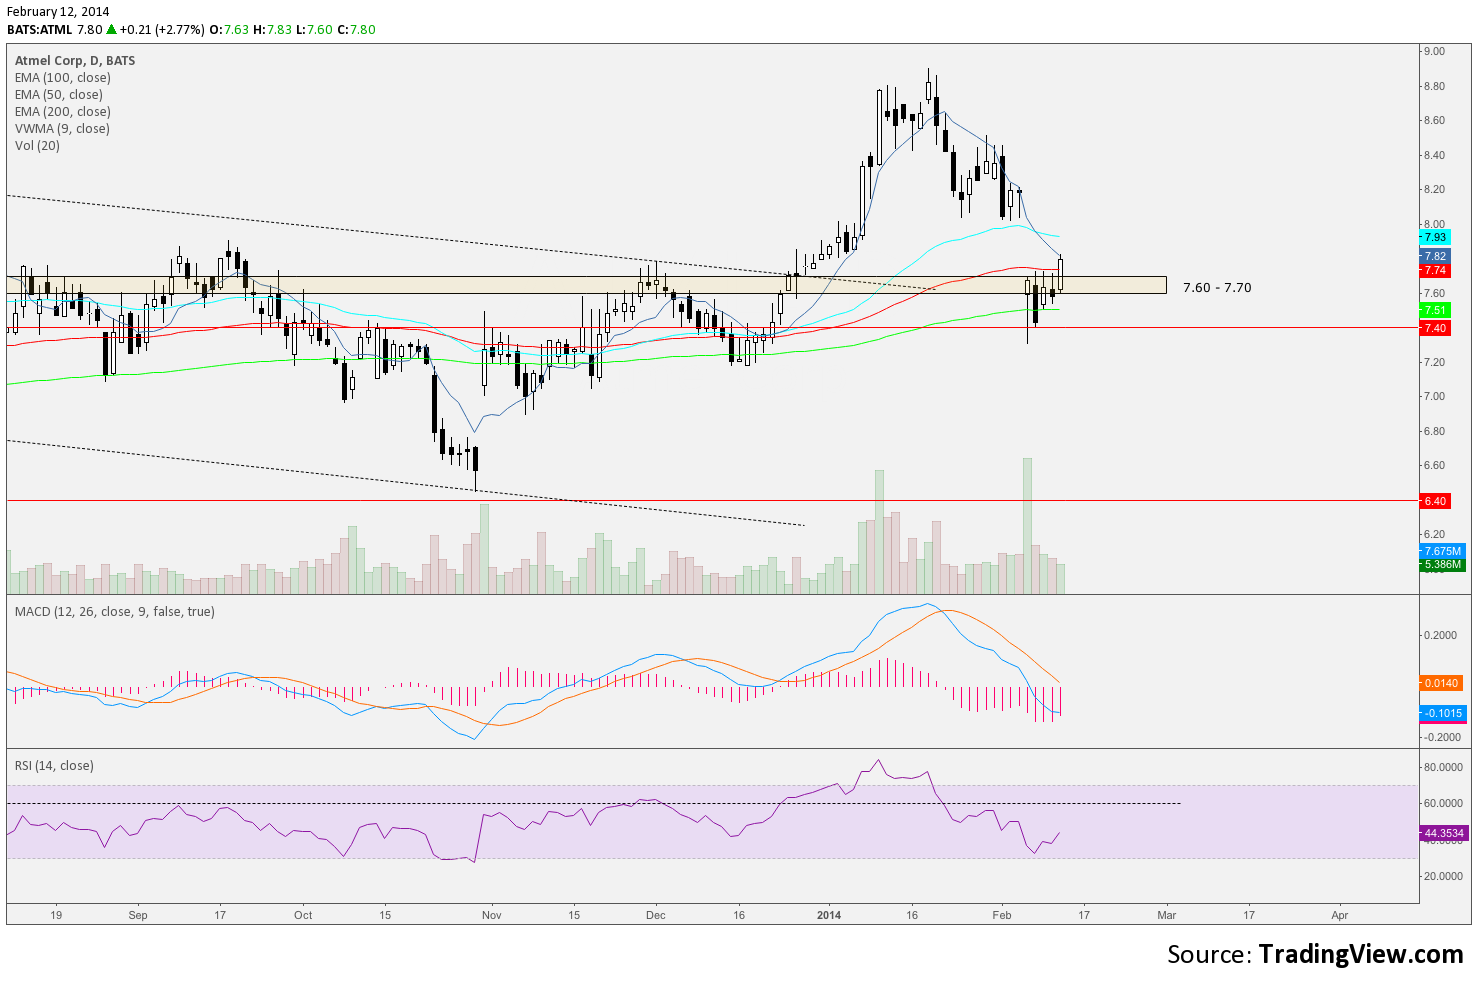
I first charted ATML in November 2013.
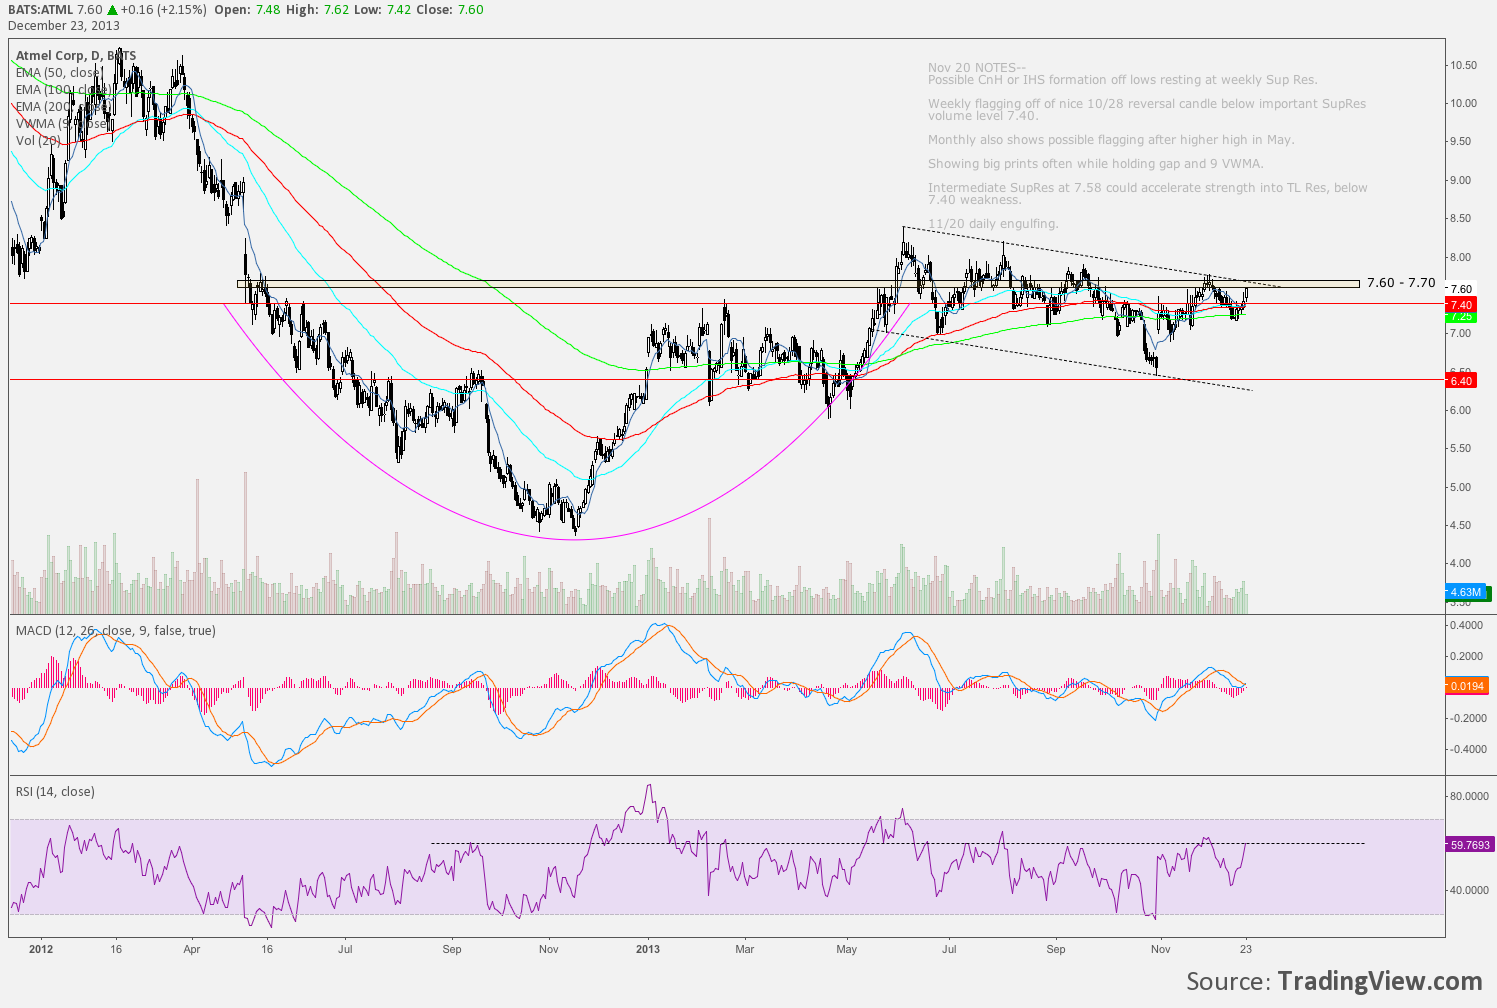
ATML continued to develop within the downtrend line with the larger weekly patterns and support and resistance remaining in play. ATML found support at its moving averages and made a move above its weekly support resistance at 7.40 in December 2013.
No position was taken unfortunately and ATML continued to climb through prior resistance without much hesitation.
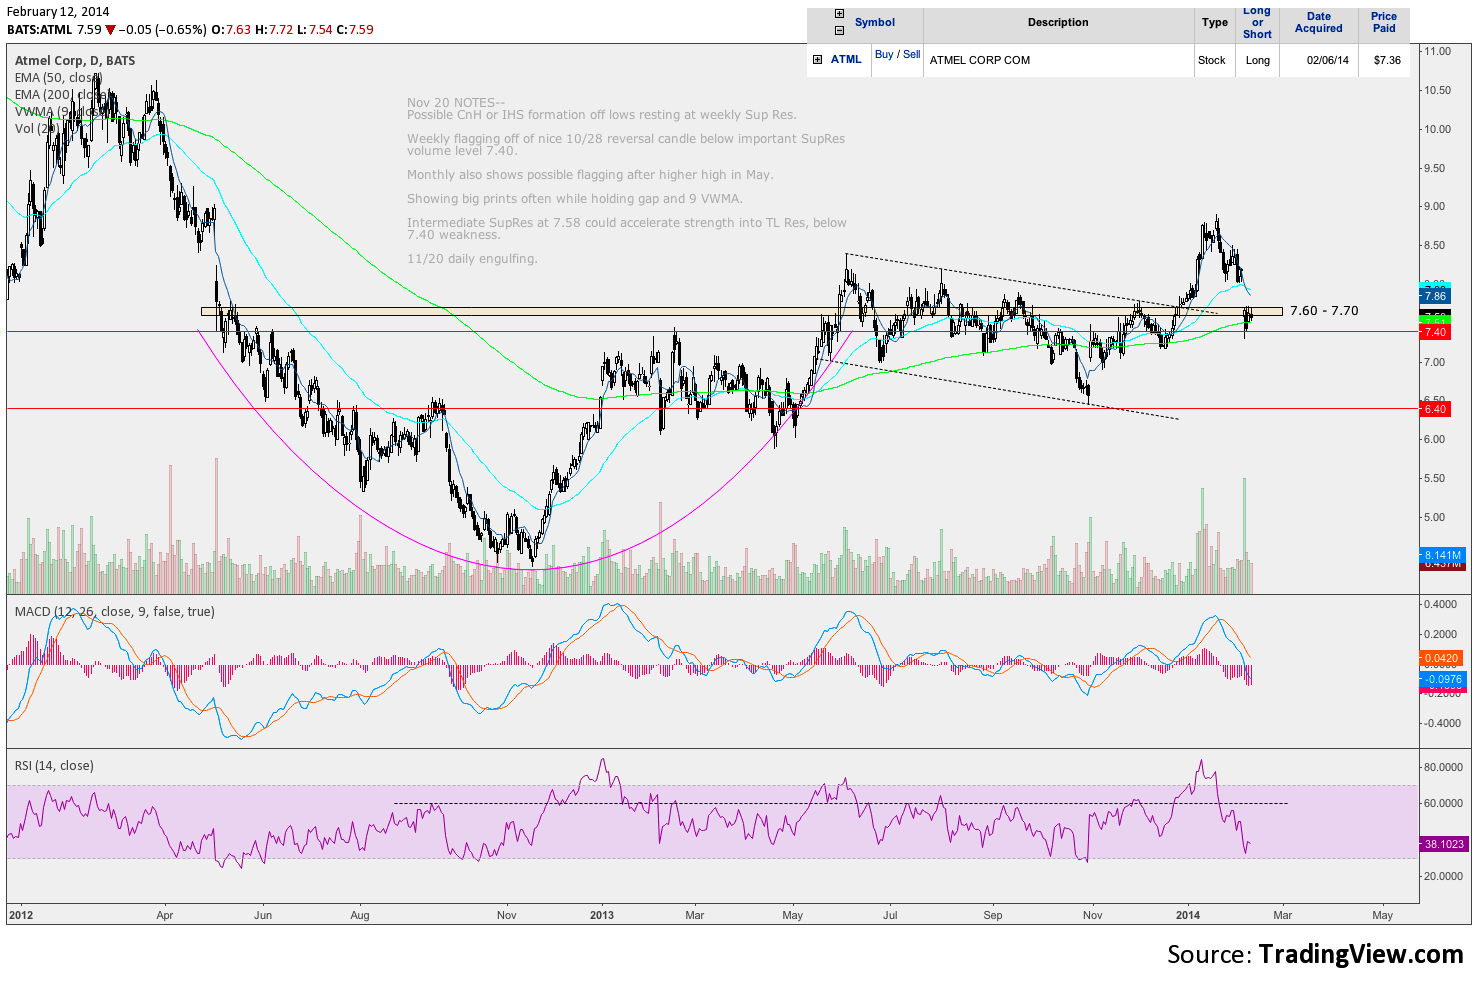
On February 5 after hours ATML reported earnings. On February 6 the stock gapped lower and triggered an alert as it traded 7.40 weekly support resistance.
After the opening swing I started to look at the price action for stabilizing at 7.40. Watching the 1min time frame, Accumulation Distribution had not made a new low through premarket into the OS but held a tight range into the lows.
Soon after the OS a 250K print was seen and Accum/Distr resistance was broken higher. I decided to take a position. In at 7.36 with a stop below the low of the day 7.30. The risk reward was 10/1 with a target of 8 just below February 5 lows.
ATML showed a nice move higher initially closing near the highs of the day of entry, but then lagged the broader market move consolidating below the 100DMA for 3 days and testing the 7.40 level once again.
Today February 12 premarket 200 shares traded in the gap at 7.85 with no subsequent action. ATML opened at the prior days close then began a fairly steady move higher after 10:30.
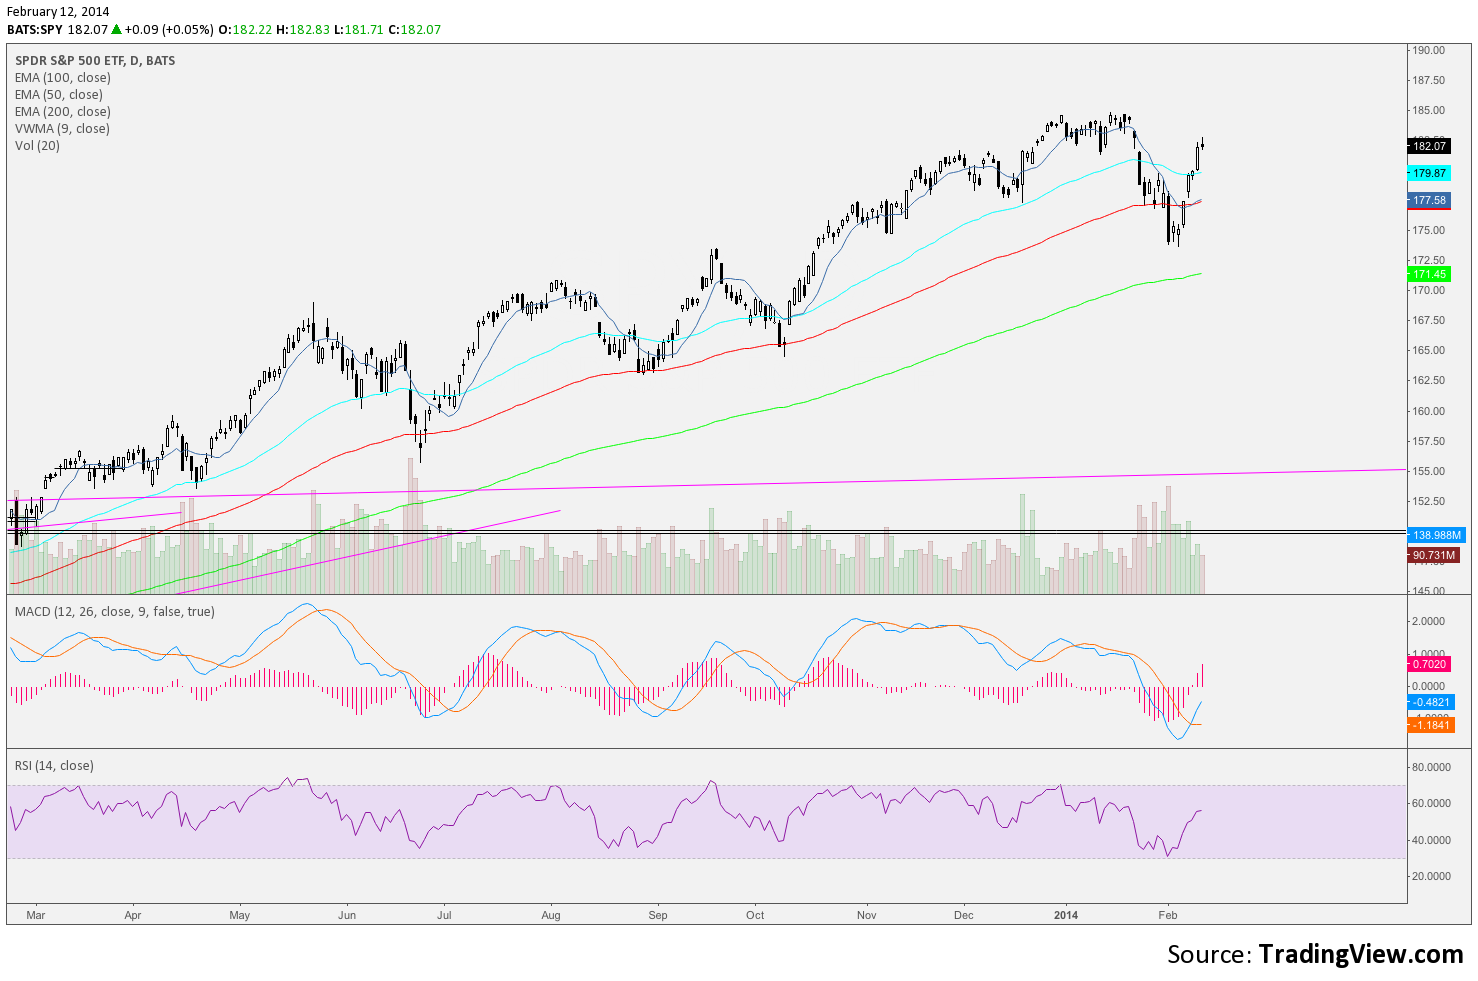
The broader market was into its 6th day of higher highs off its lows. Possibly extended it showed controlled weakness most of the day.
As ATML reached what would be its high of the day and touched the 9Vwma just below the premarket print I decided to take the trade off and took 7:1
ATML could continue higher with or without broad market strength. Support resistance levels remain the same.

