Just a few additional charts of NGLS as it develops since mention on Jan 6. New charts below reflect the midday price action.
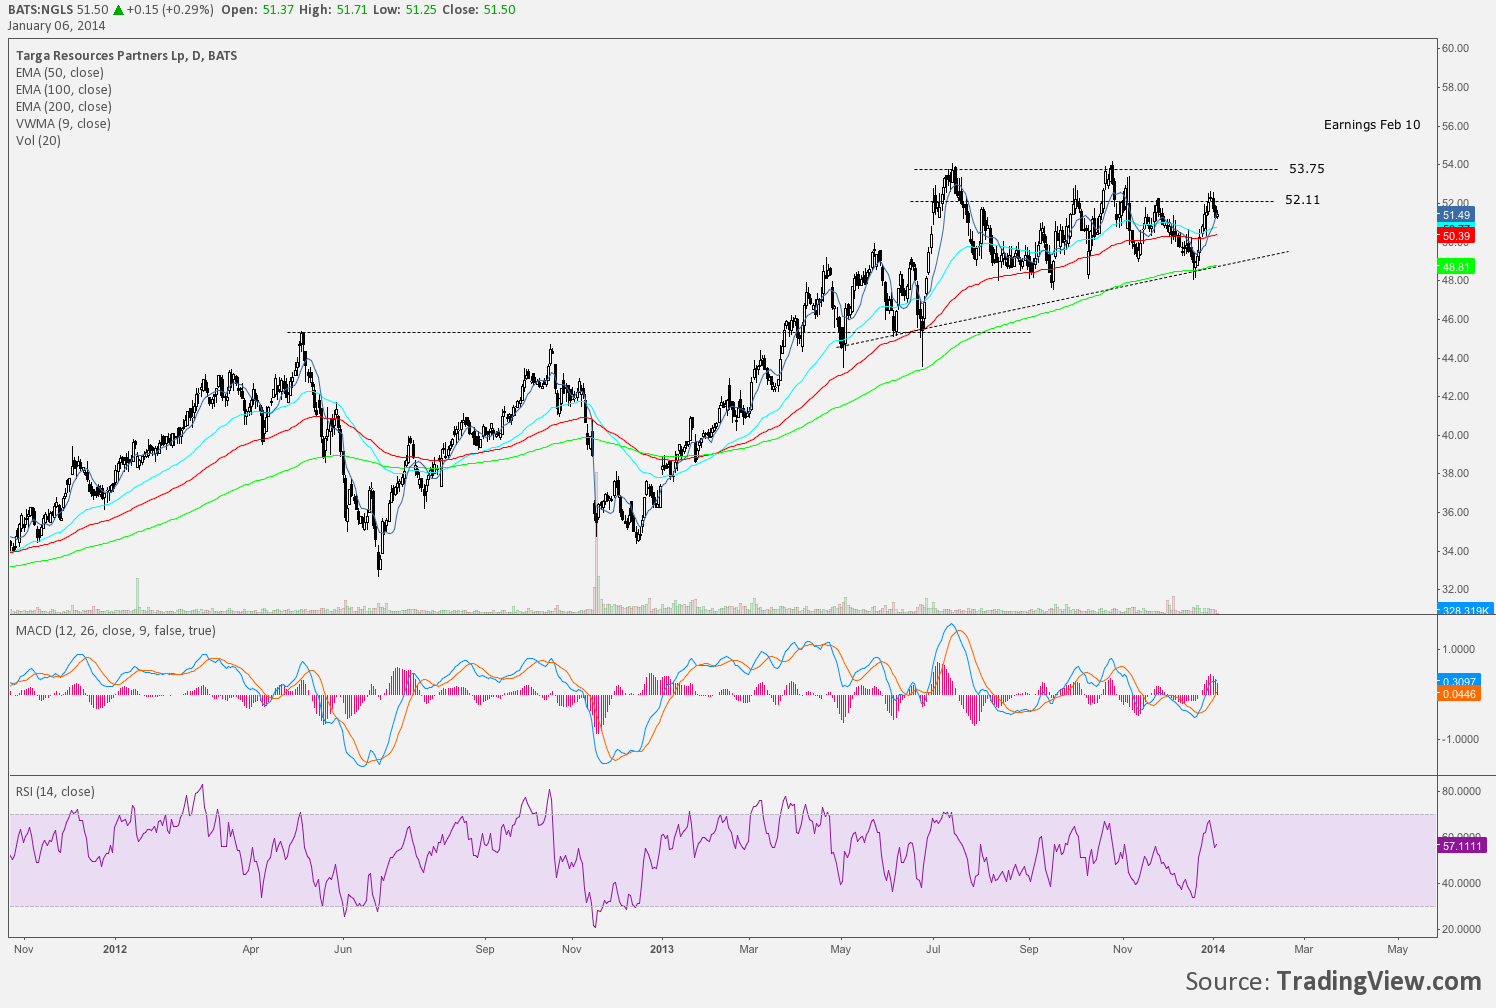
Jan 6 chart below.
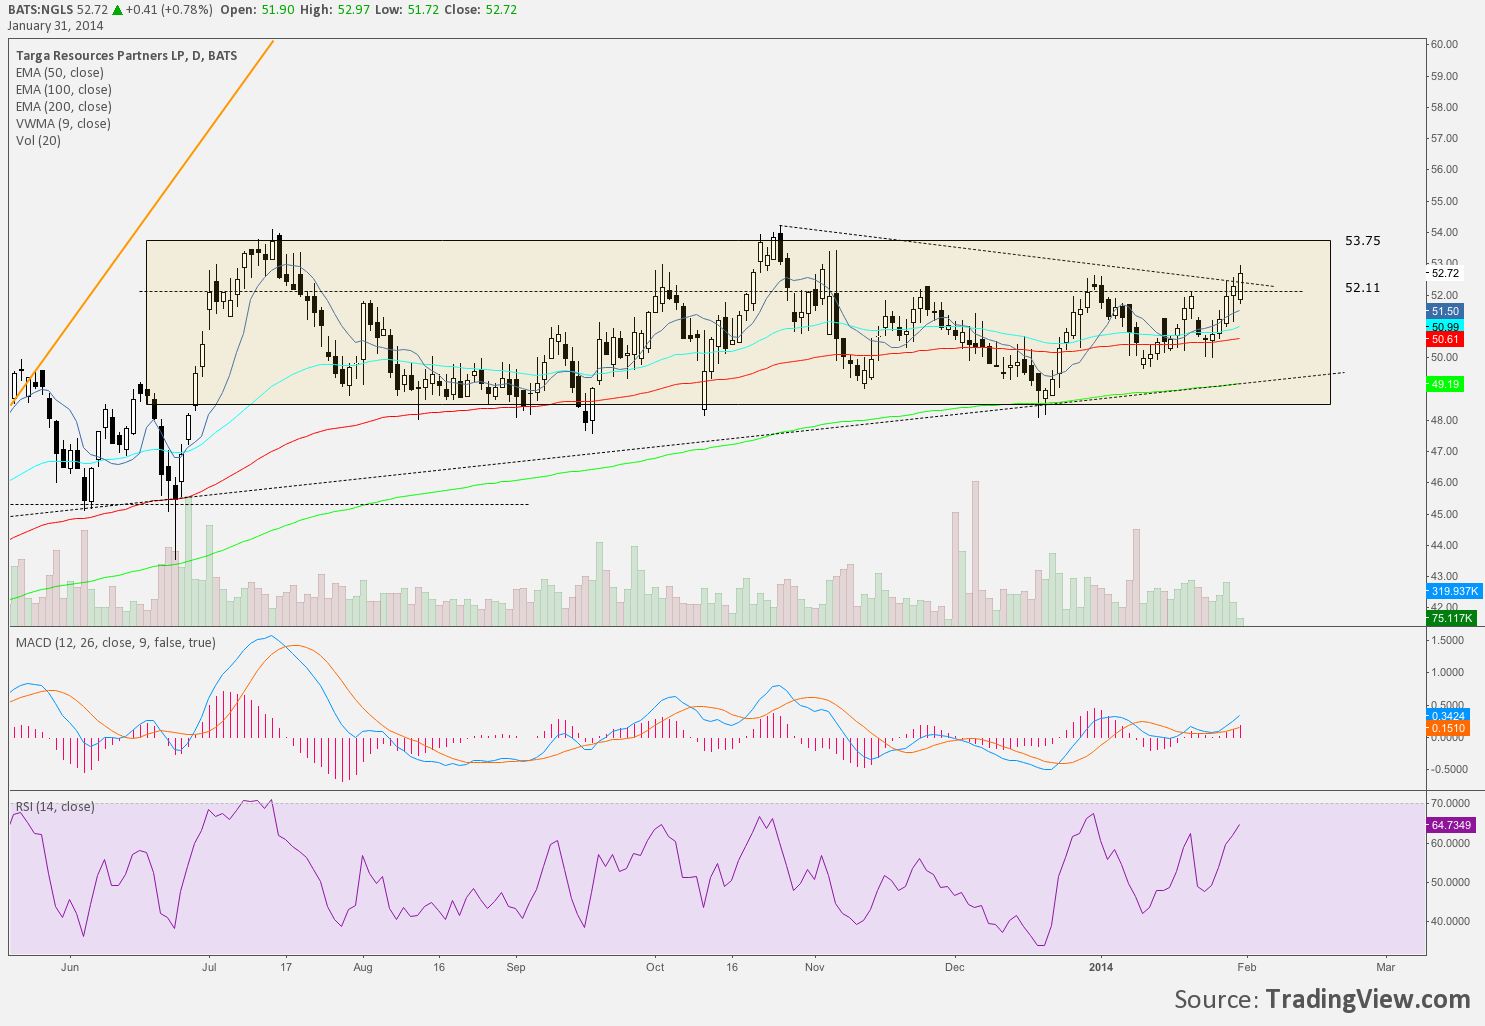
Midday daily chart of NGLS Jan 31 below.
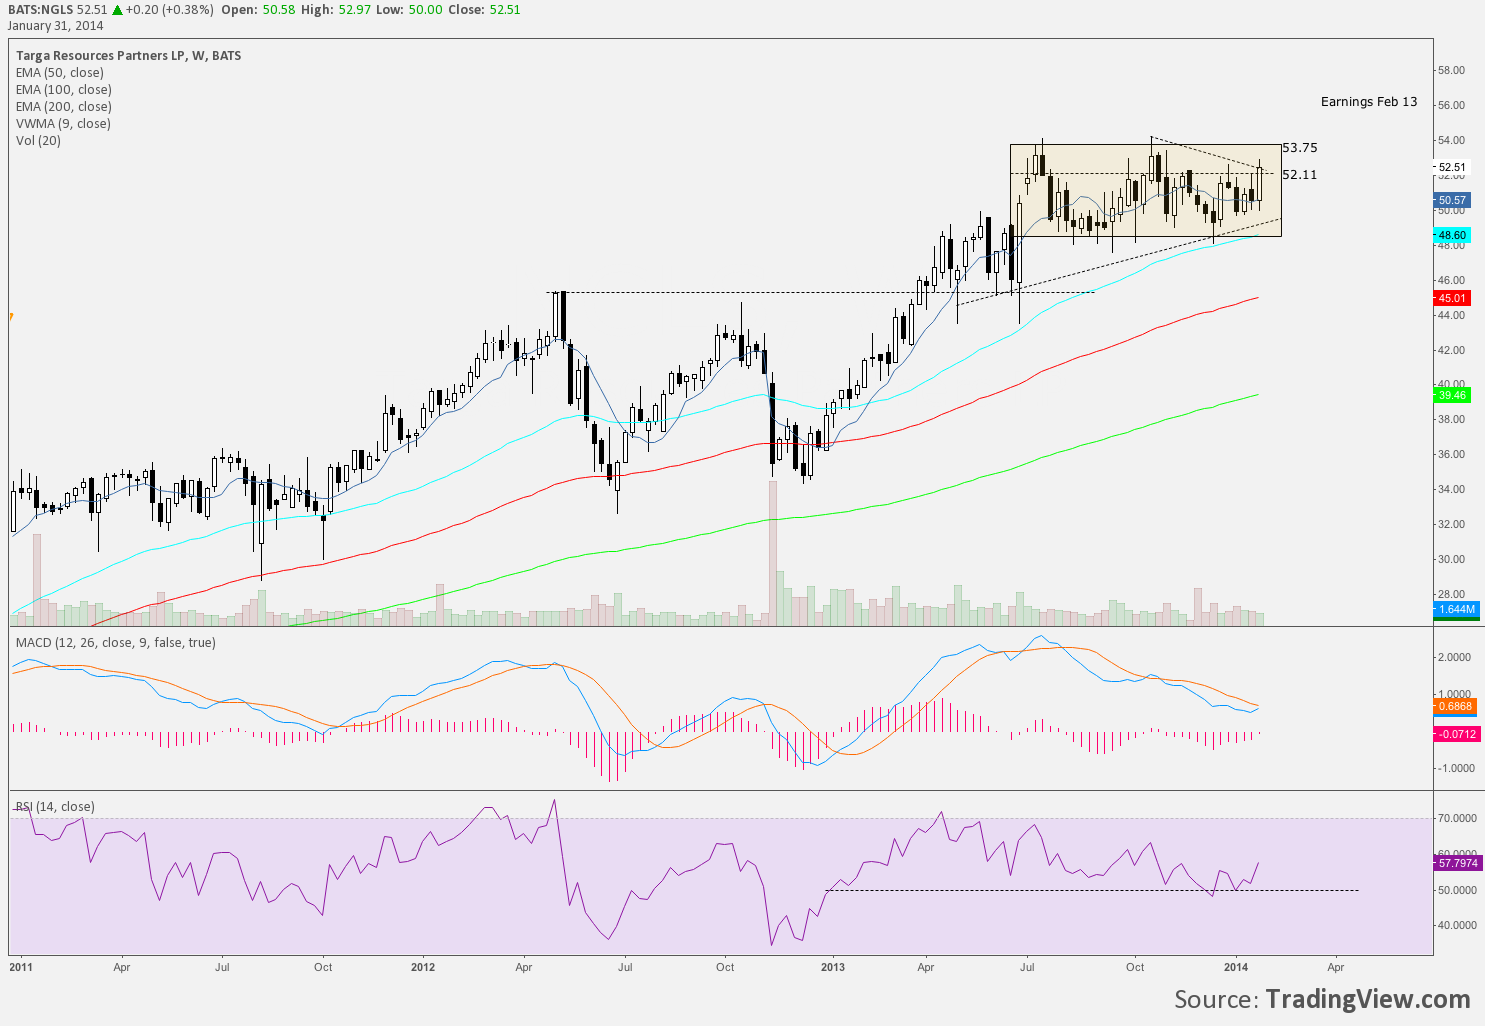
Midday weekly chart of NGLS Jan 31 below.
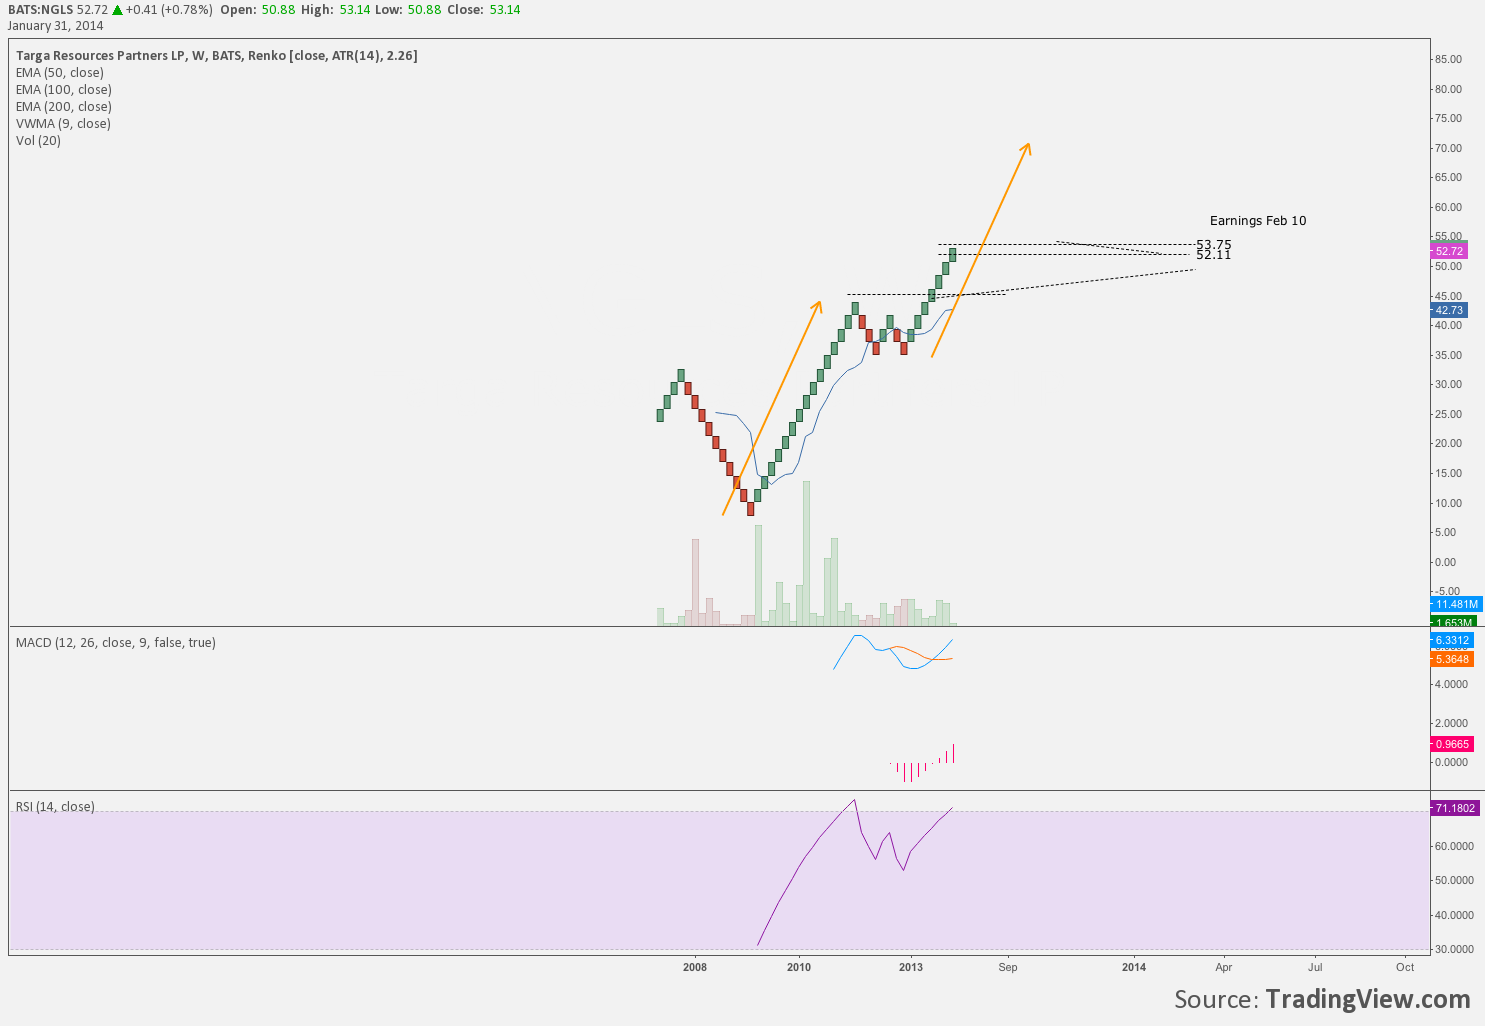
Midday weekly Renko chart of NGLS Jan 31 below.
Initially possible daily ascending triangle to form resistance levels established.
Daily consolidation range/box above 2013 highs.
Todays midday daily strength to possibly close at higher high for Jan through 52.11 resistance.
Daily MACD possibly setting up move to top of box from positive territory.
Weekly MACD ready to signal with push through highs.
Weekly RSI holding 50 through consolidation.
Weekly Renko measured move tgt 70.
Earnings Feb 13.
— Continue to monitor, see how things close.


