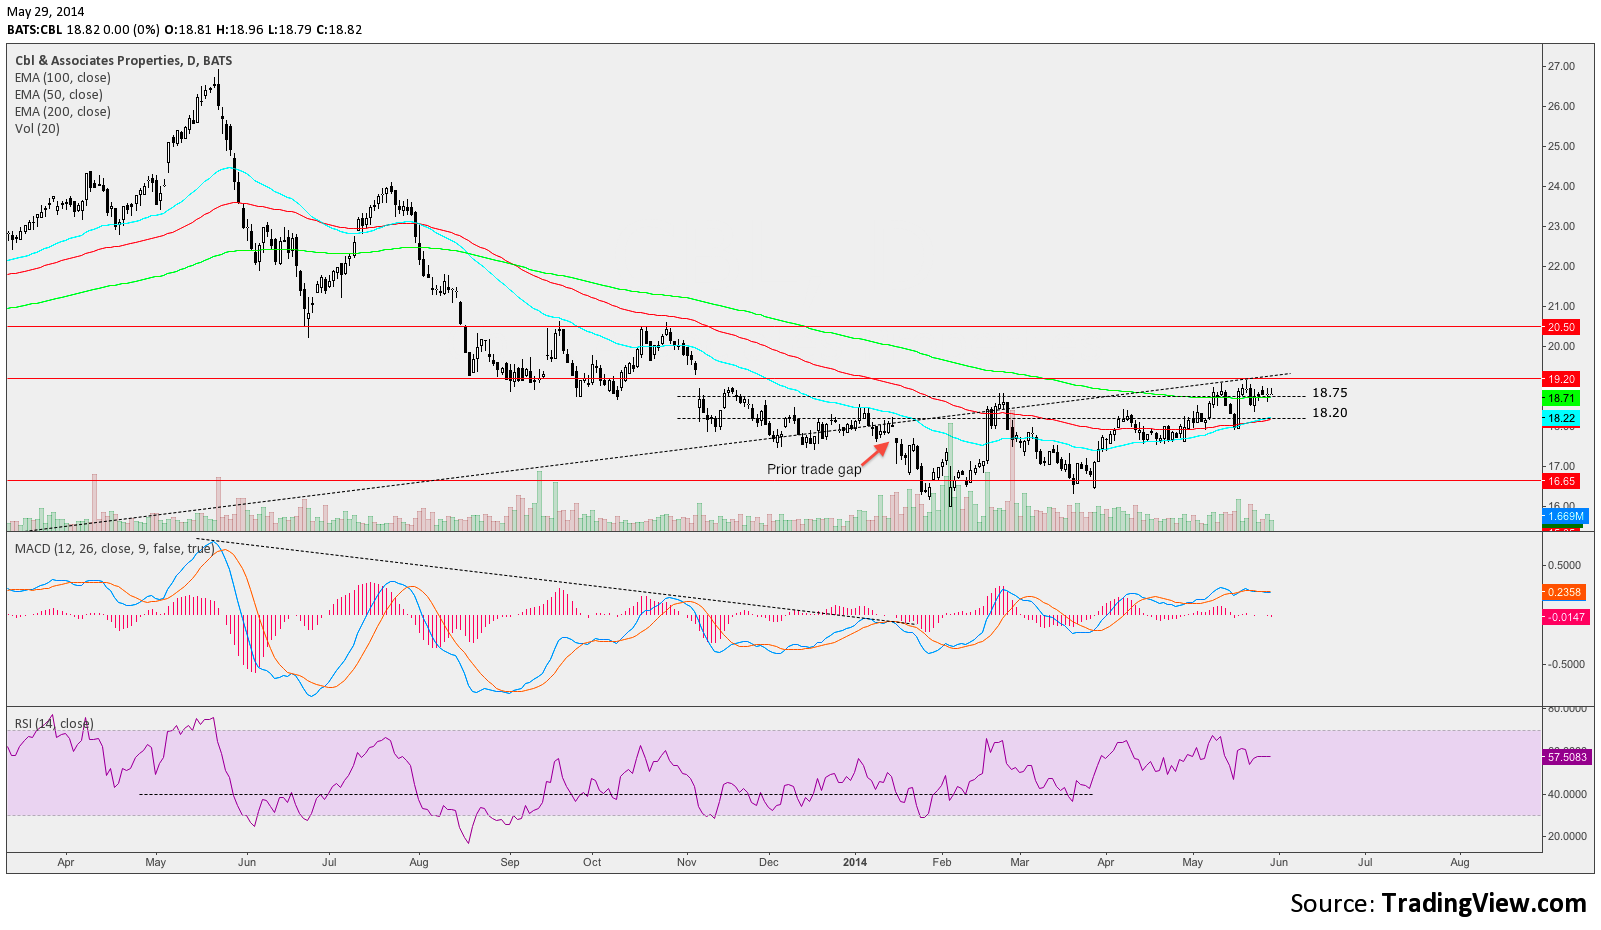
Prior breakout and trade in CBL earlier in the year had failed to develop- link. In late May CBL had now shown support above the prior gap lower and holding steady above rising moving averages.
In June CBL had tested the larger 19.20 breakout level setting off alerts it may look to set up for higher.
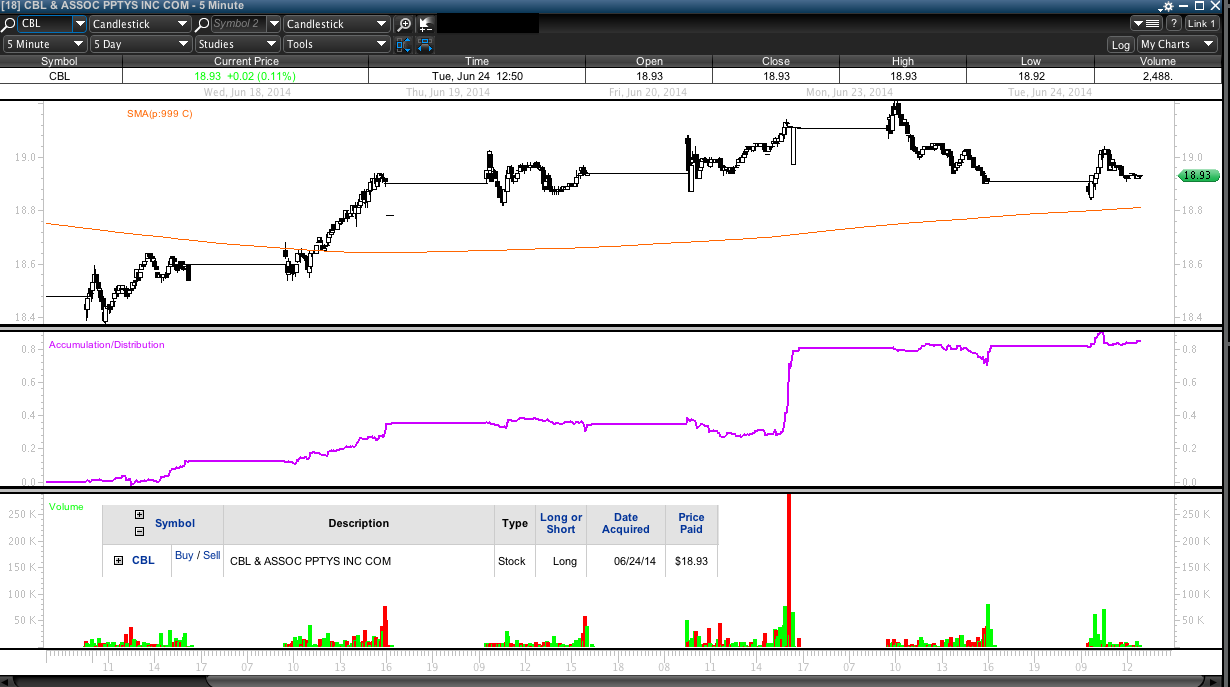
On June 23 CBL tested the 19.20 level resistance, its third attempt in a months time as it built an small ascending triangle against that level with rising moving average support. Below is a 5min chart at trade entry showing an increase in accumulation, my stop below the prior daily swing low.
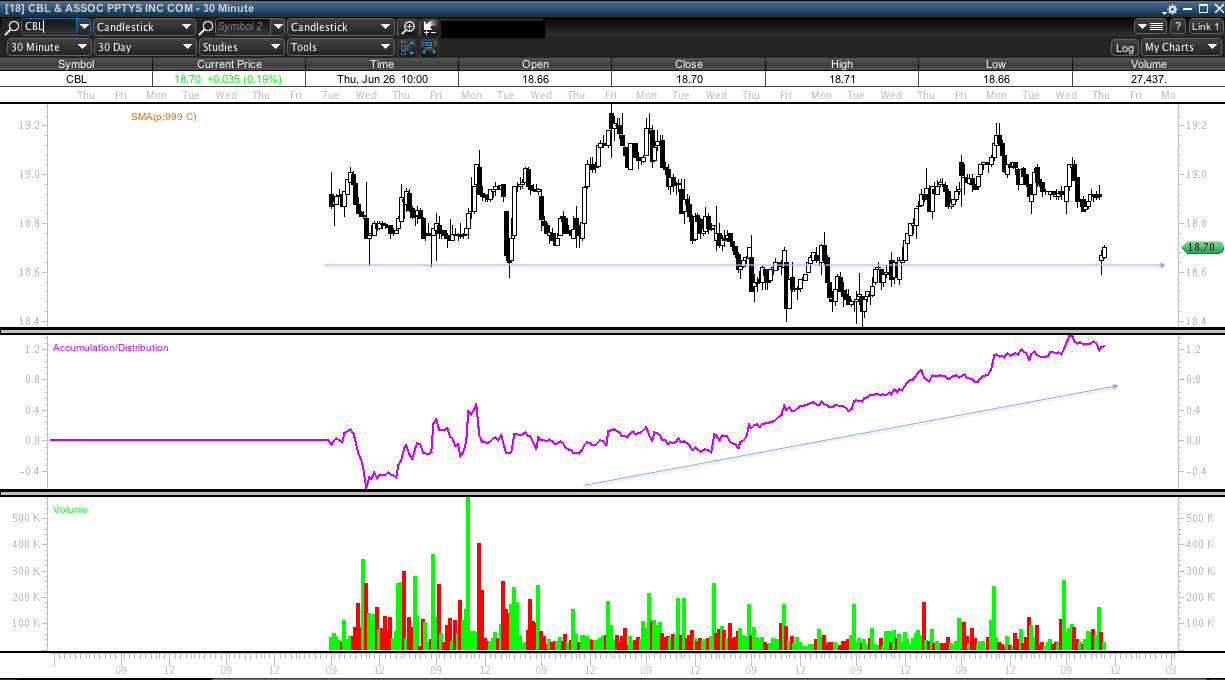
A couple days later CBL gapped lower testing its 50DMA and rising trend line support. The below chart again shows intraday accumulation at the 30min time frame.
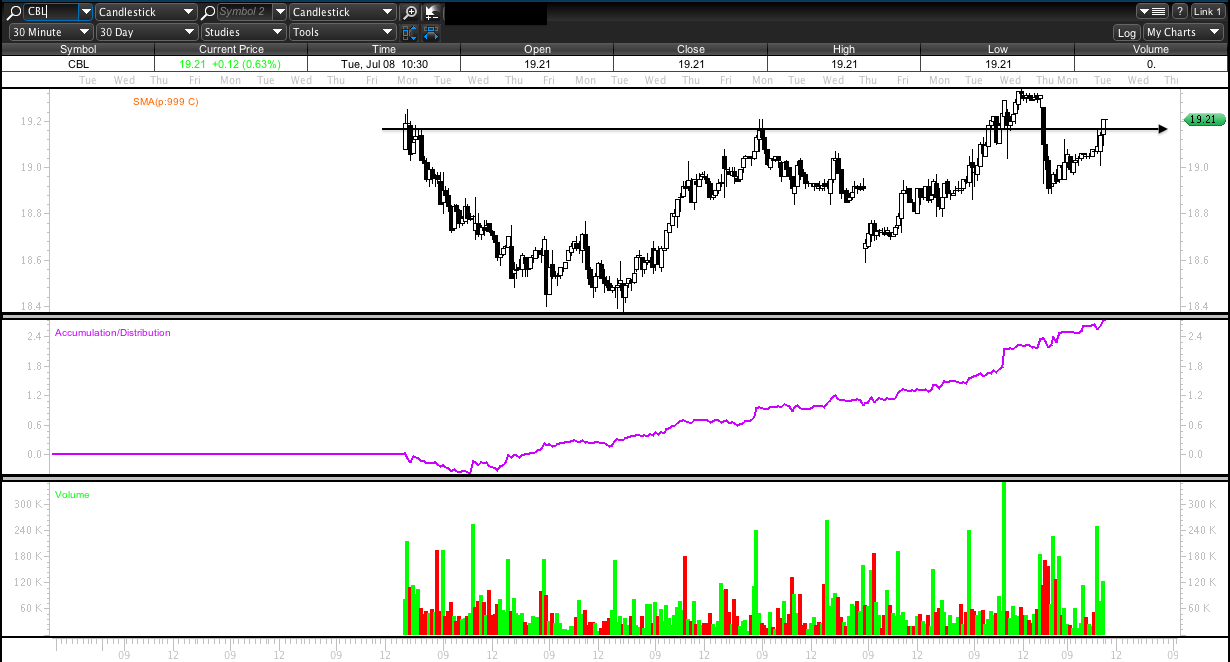
In early July CBL attempts to take the 19.20 resistance level again.
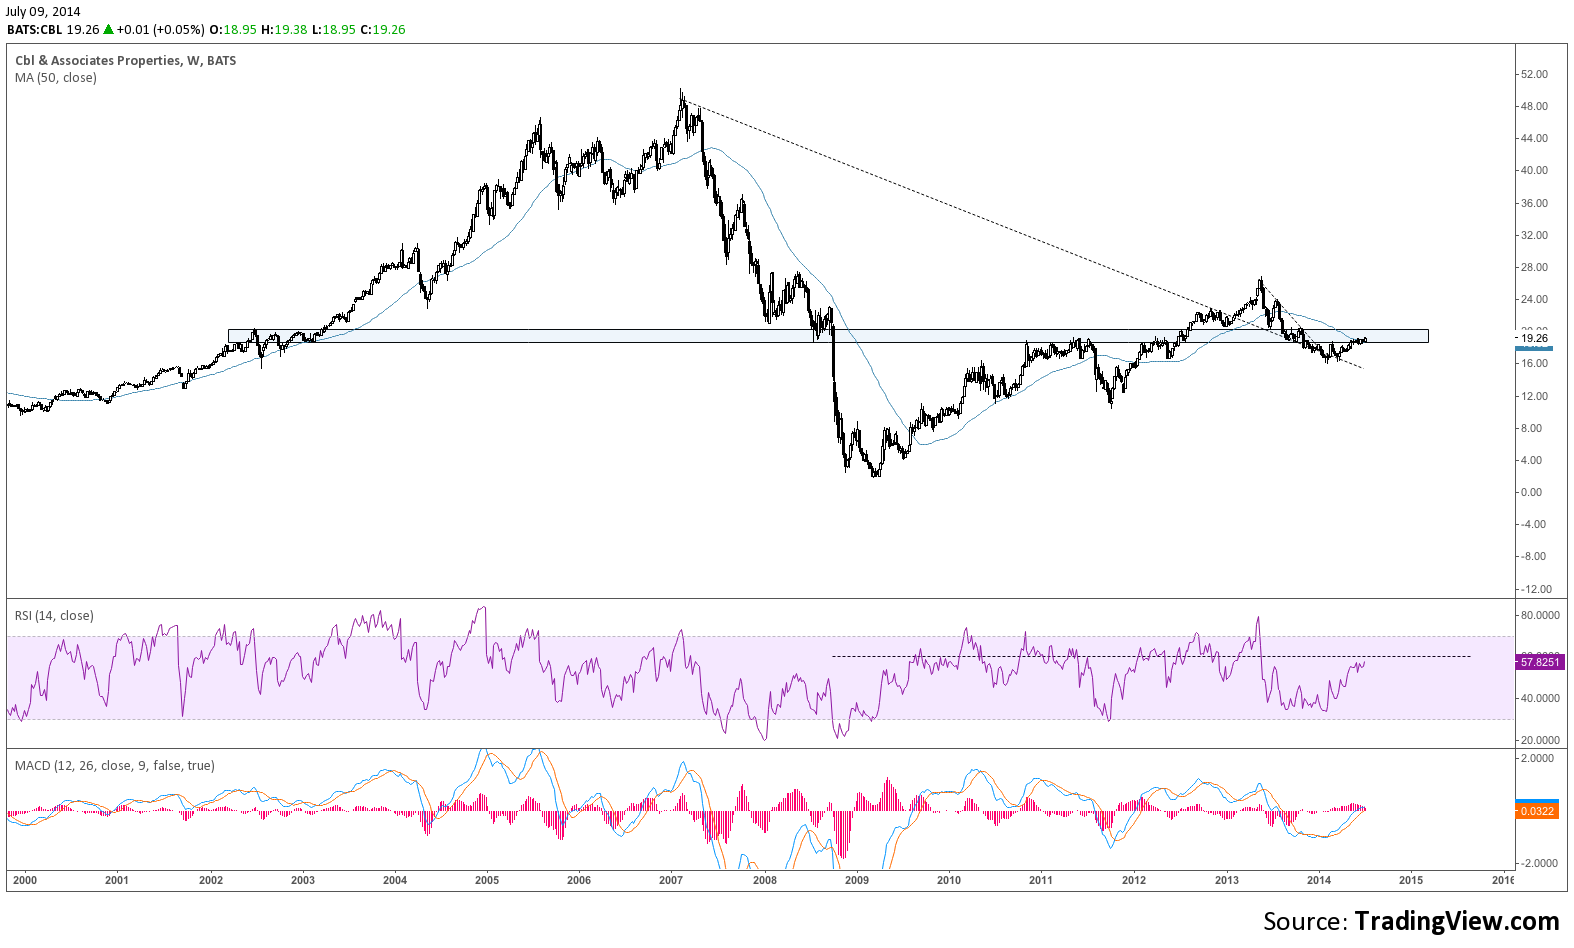
Below a weekly chart of CBL in early July shows the potential for space higher if support at 19.20 continues.
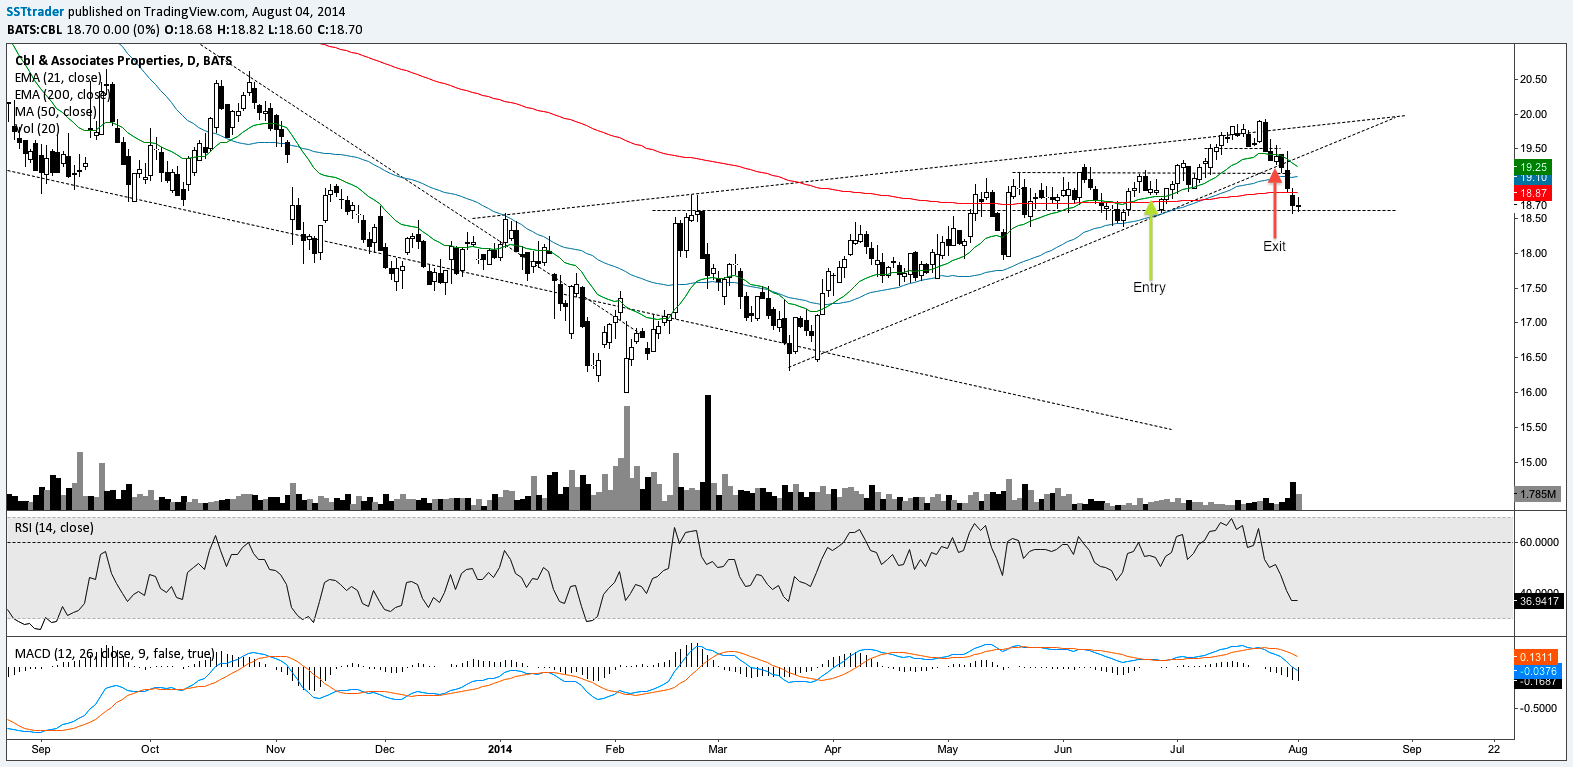
CBL reached a high of 19.94 testing rising TL resistance. When CBL did not hold intermediate support resistance on July 24 I became cautious on potential reversal candle. The following day CBL closed below the 21DMA support to the swing higher . On July 28 I sold CBL for + .50 as intermediate SupRes failed again.
Even though this price action did not hit my swing stop, market conditions were becoming difficult for swing trades and as CBL approached the rising wedge SupRes below my concern at intermediate time frames highlighted potential for a large move or even gap lower from important 19.20 level.
Below daily chart from August 3 close shows subsequent price action from exit is so far a round trip.

