I first started looking at SBRA in January. Long term weekly support resistance was 25 – 27. A large rounding bottom was apparent and the possibility for a inverse cup and handle from weekly resistance developing. January 2014 chart shown below.
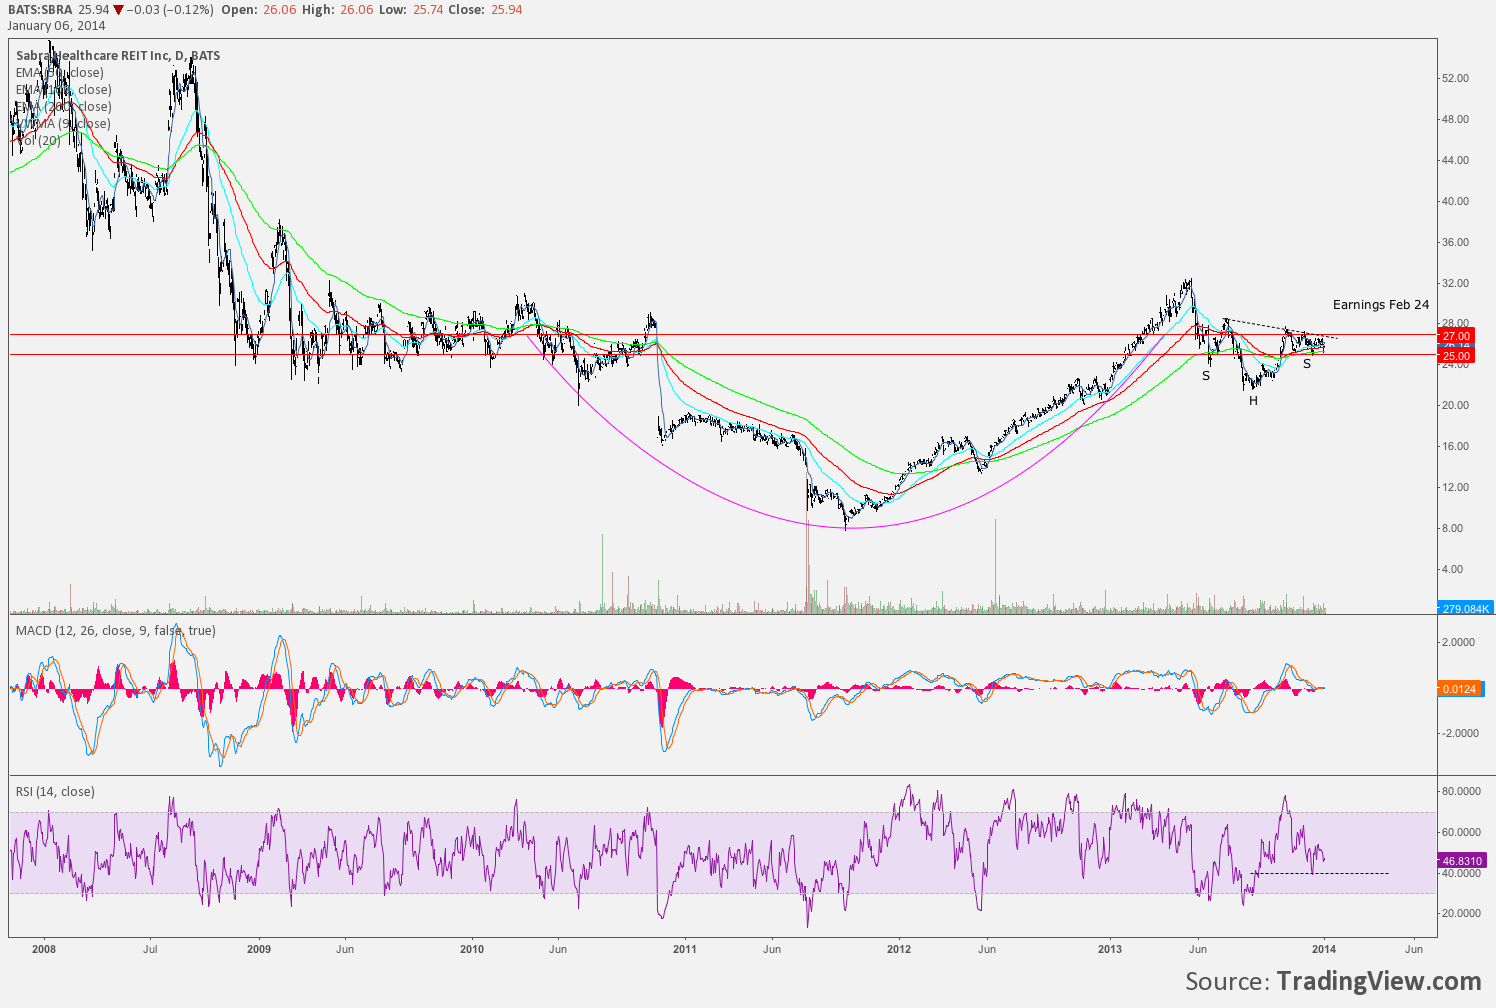
The weekly support resistance levels are an important tool in setting up a low risk entry. On February 12 SBRA pulled back to the 27 level and printed a possible hammer candle.
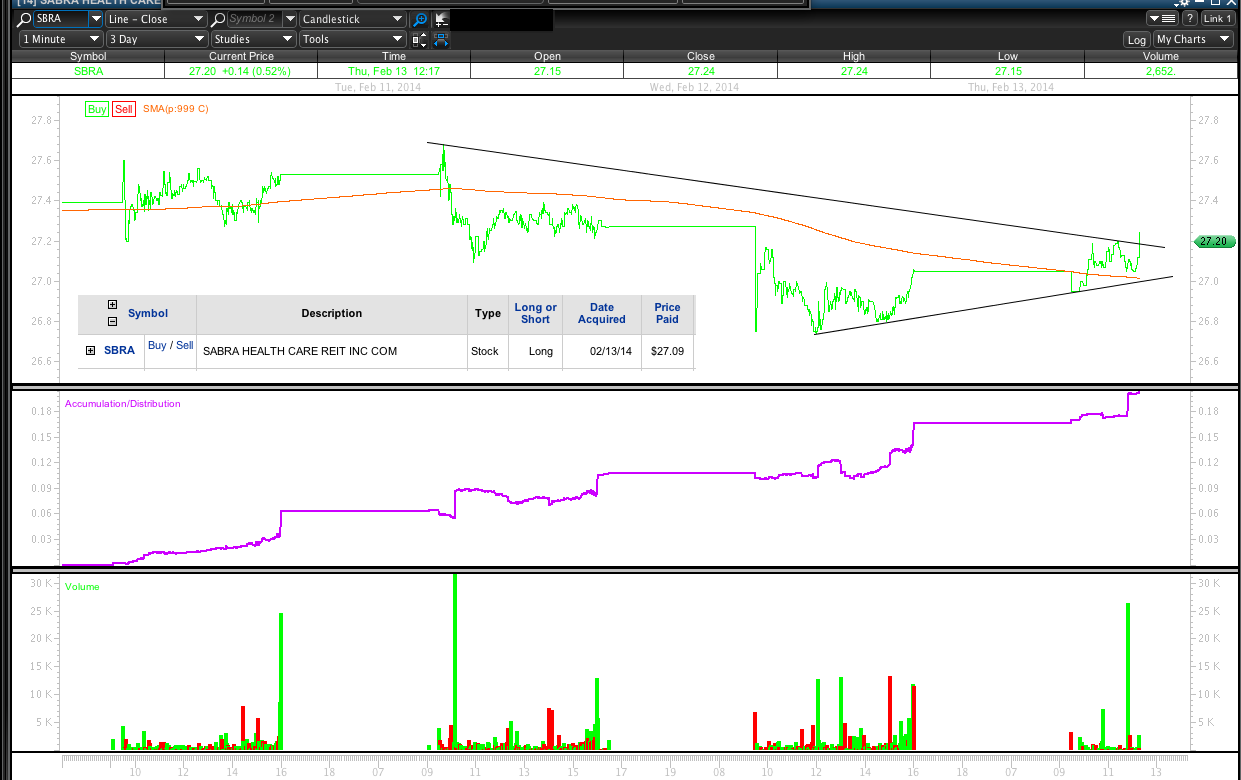
Price was beginning to show signs of support into the 27 level. Larger prints were seen and divergence in Accum Distribution as well. February 13 multi time frame chart below.
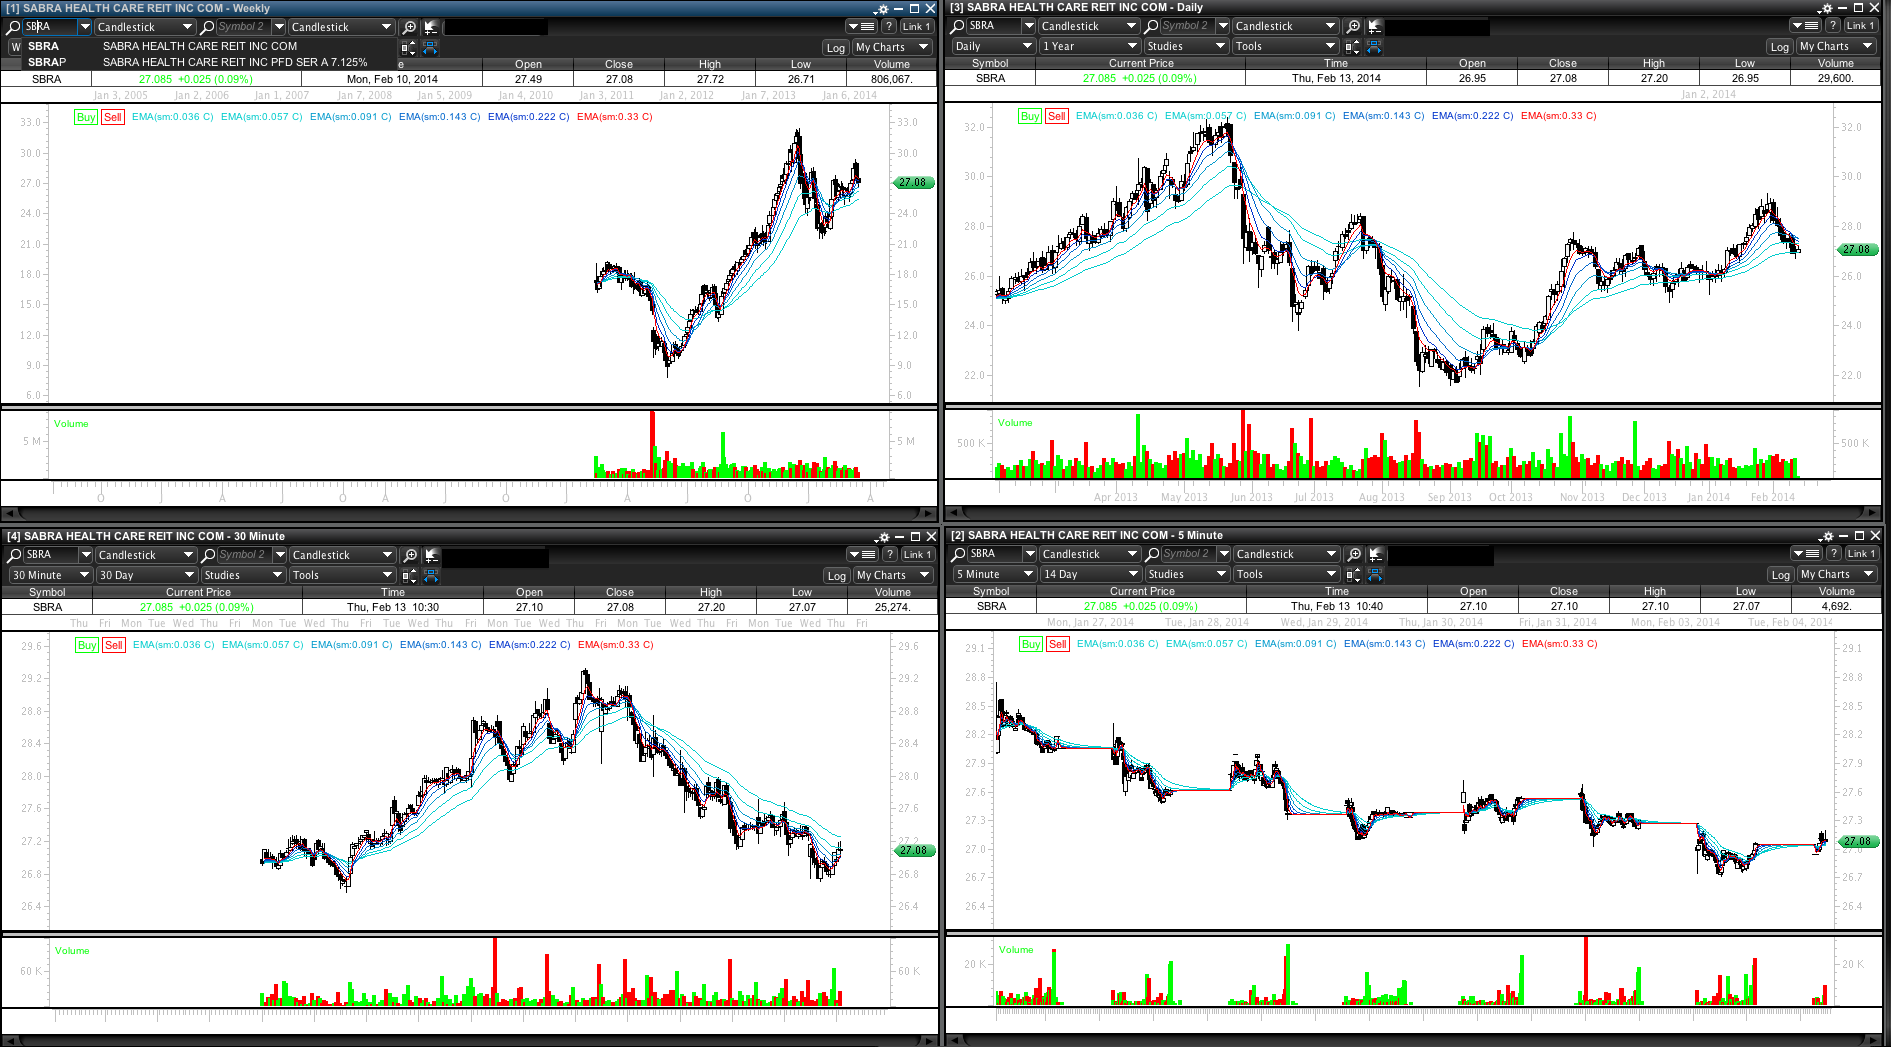
A position was taken on Feb 13 open with a stop below the prior days low.
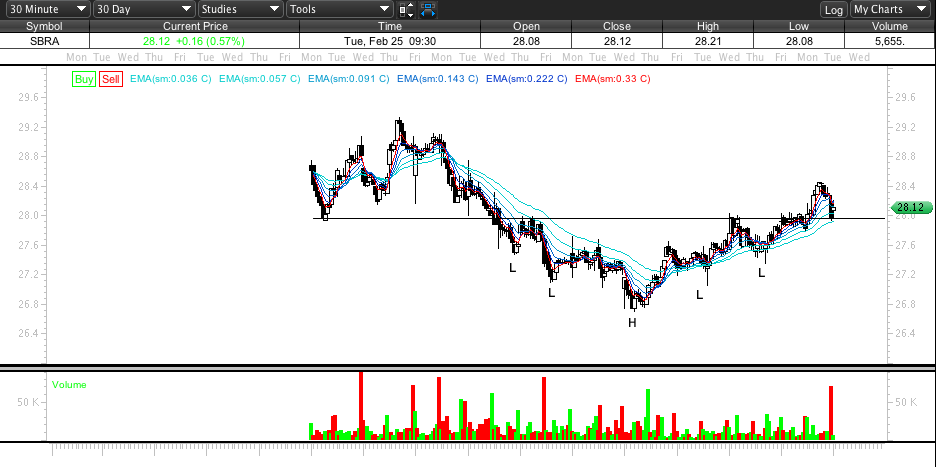
SBRA broke higher and began forming what could be an inverse head and shoulders from that low on the 30min time frame. IHS chart shared on February 25 below. Marked up with too many left shoulders but the pattern was the point and so far stands up.
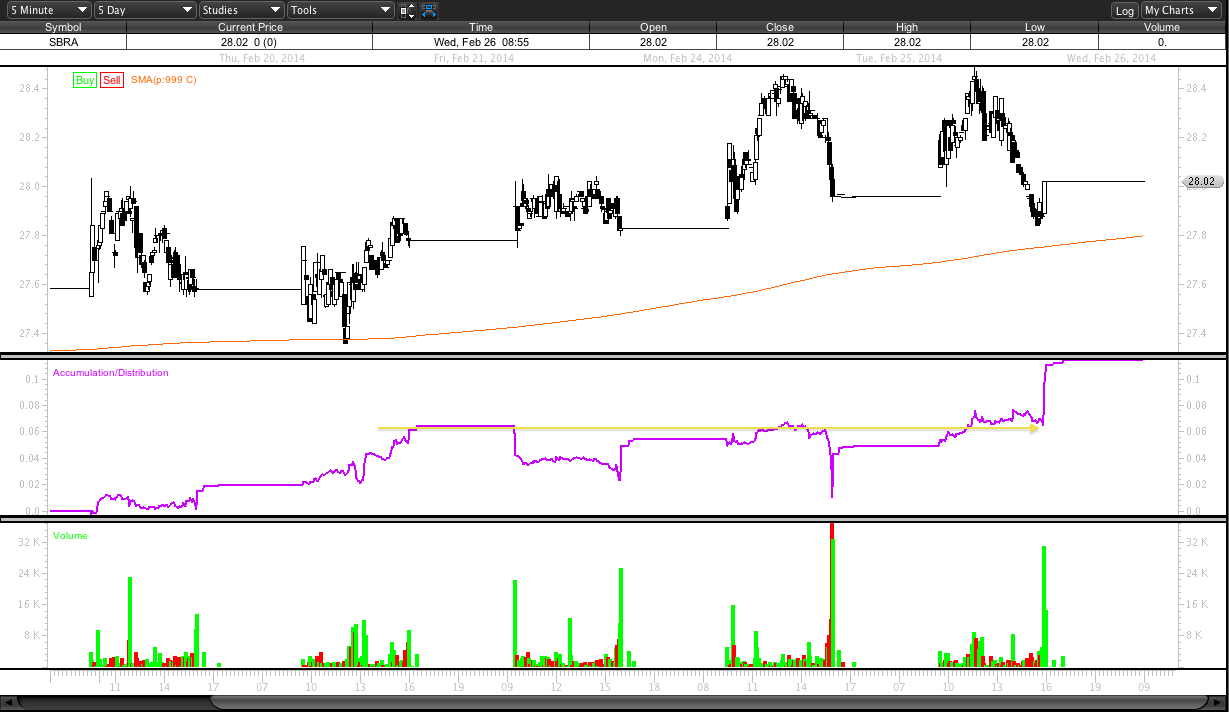
On February 26 more possible divergences in the Accumilation Distribution. 5 minute chart below on close before earnings release.
SBRA pretty much floundered and chopped about after earnings but has continued to show divergences at slightly higher time frames since. Chart below from March 4 close shows 30min comparison to lows.
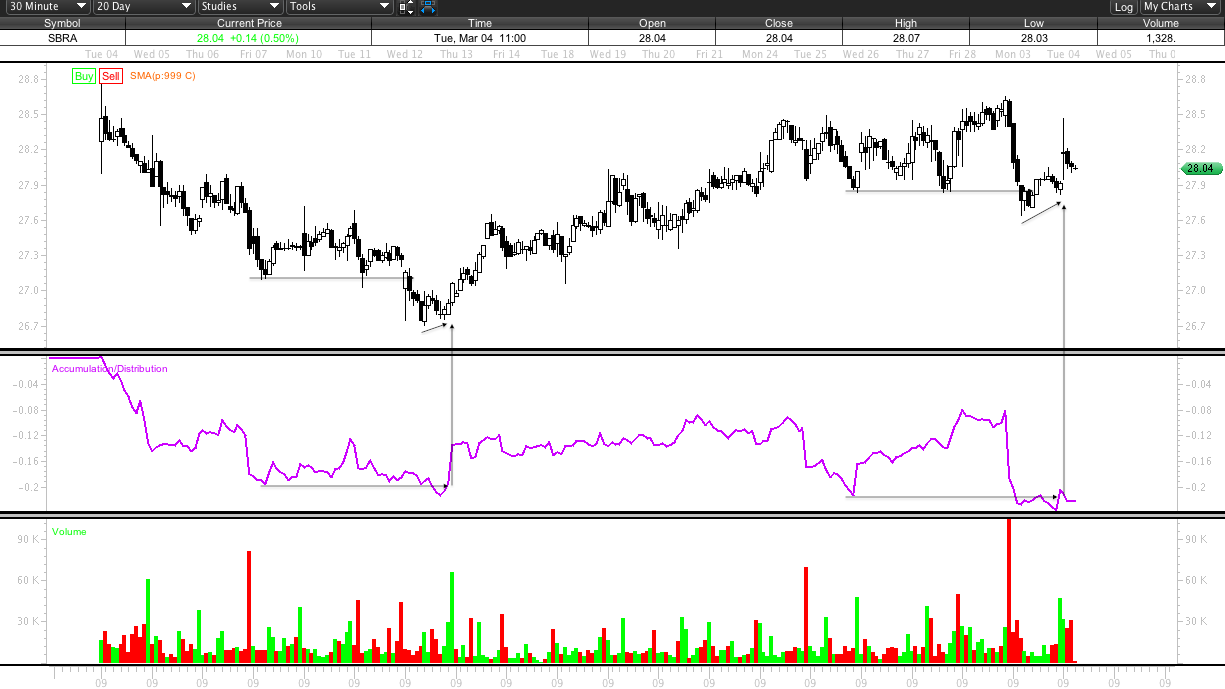
The divergences here have taken place off an interesting price area of 27.84. This price happens to be a possible Renko support resistance level to an even larger inverse head and shoulders pattern. Daily Renko chart taken March 4 below.
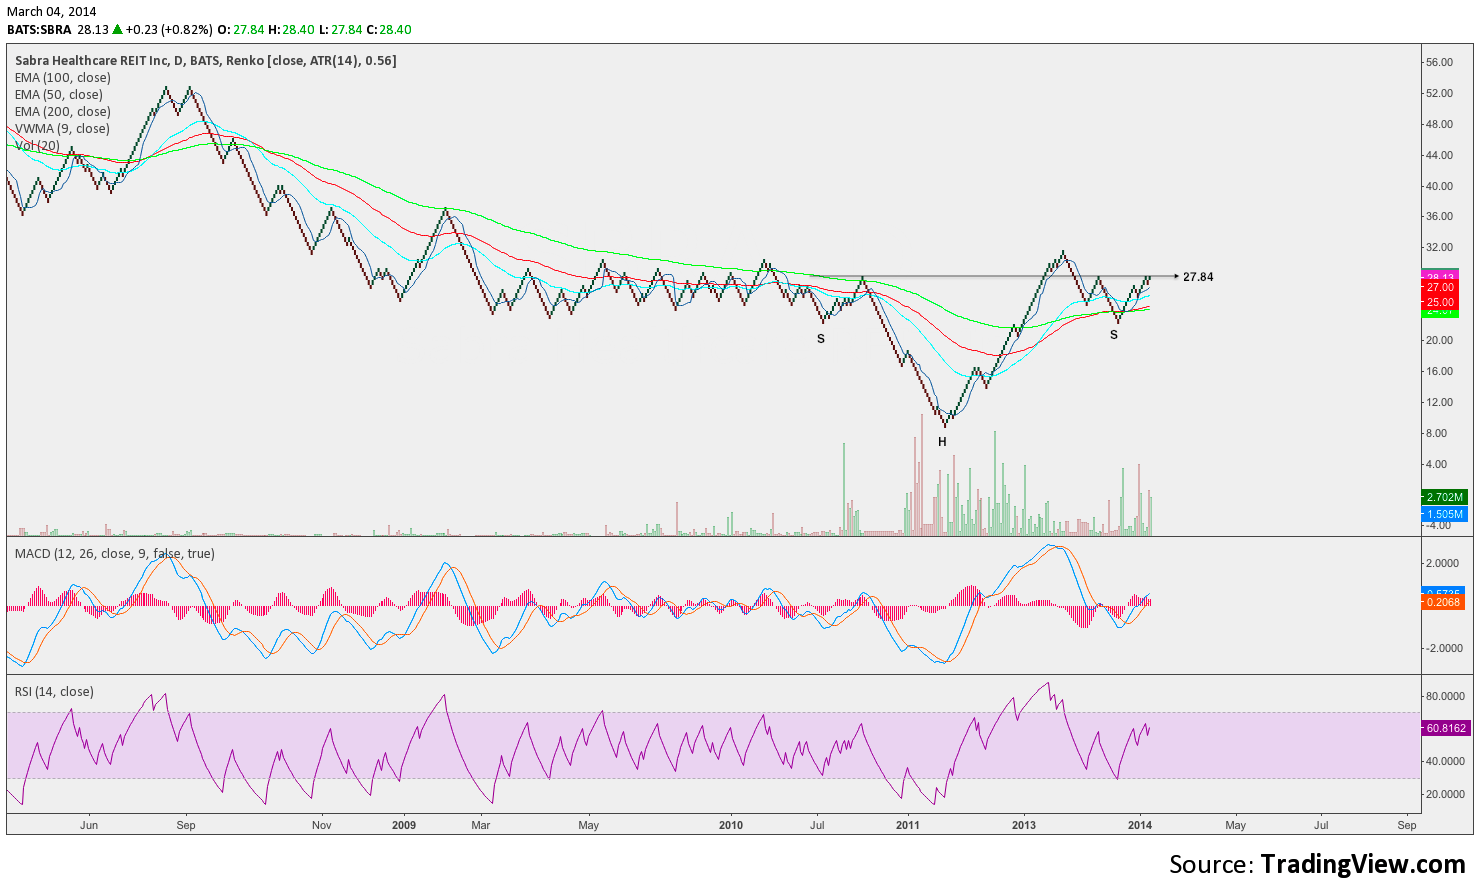
March 5 2014 SBRA has pushed below the 27.84 level but is currently still diverging on the 30min time frame. Expectations were for this level to hold by close. It did not.
The 30min chart at close March 5 below shows possible continuation of this divergence to the 618 Fibonacci level, also an important level to the IHS right shoulder.
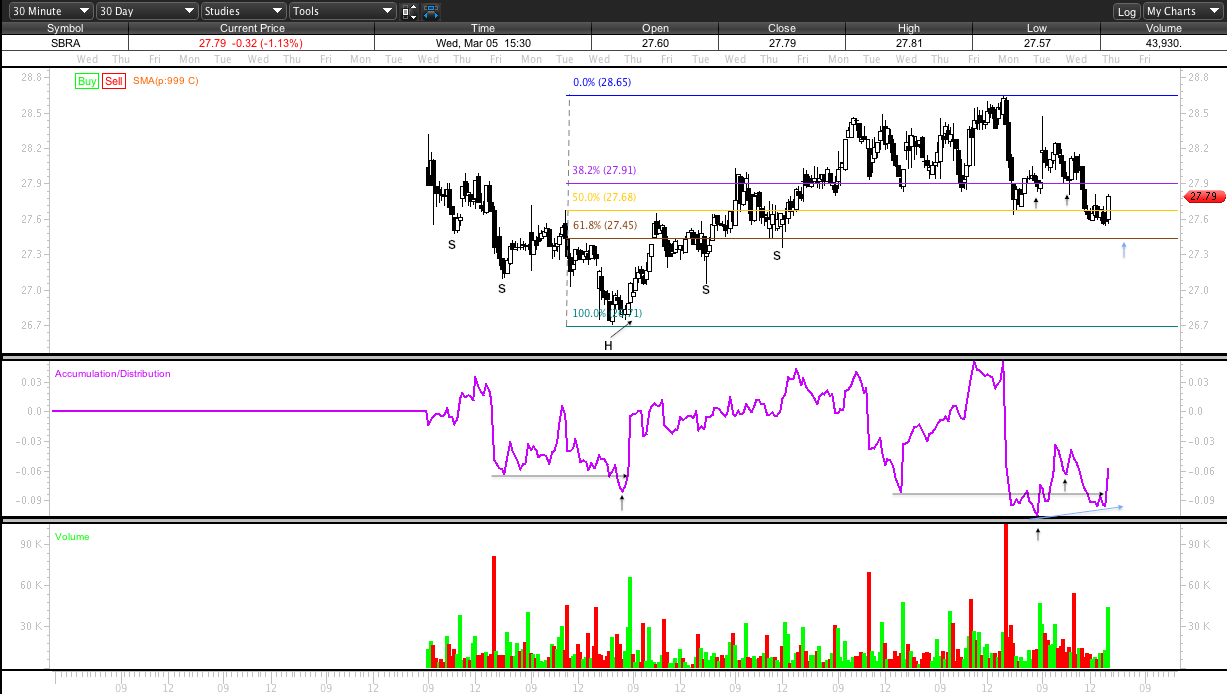
This is a swing trade that could start a trend higher to 40$ if the pivot lows hold. As much as it hurts to hold SBRA through todays action my risk reward is 10:1 even if SBRA only hits low 30s.
Today March 6 SBRA closed at 27.84.
I will update the trade in the comments or separate post when I exit.
