|
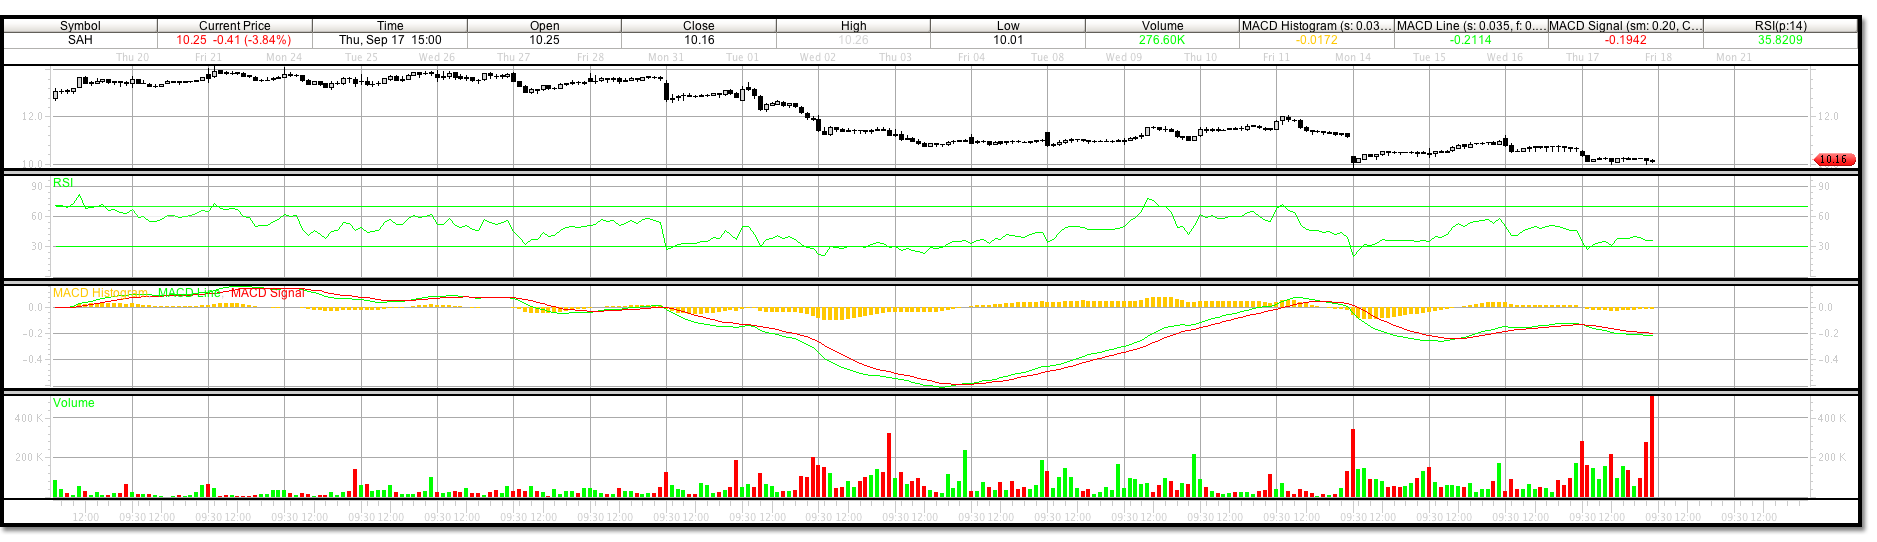
Buy trading signal triggered on SAH on September 17, 2009**. |
| SAH- Buy signal triggered on SAH on September 17, 2009* | |
| Trading signal for 30 minute price bars | |
| Buy price: $10.15 | |
| Sell stop price: $9.89 | LEVEL HIT – September 21, 2009 |
| Short term profit level: $12.87 | LEVEL HIT – October 15, 2009 |
| Long term profit level: $14.71 | LEVEL HIT – February 8, 2011 |
|
Todays sell stop was quite dramatic. Lets see if we can analyze if we had the wave count correct or perhaps were a day early on the buy signal. Sometimes the ABC correction will have a triangle correction of 5 waves following the C wave. Although this is often the case it is not always recognized due to lack of volatility in the trading time frame. Usually it can be observed in lesser time frames. If we look at the sell stop signal chart according to the MACD levels, we could consider the largest MACD wave shown as wave 3 of 5 of the C wave at approximately September 4, 2009. The wave 4 topped out around September 11. Wave 5 bottomed on September 15. Our buy signal was triggered on September 17. This was the correction wave 2 of the sequence of 5 additional waves that we are speaking of. Wave 3 of this final sequence topped off on September 18, and wave 5 today September 21. When speaking about price, wave 1 can be identified when a wave 2 does not violate the wave 1 trading turn low. So far this has been a traditional triangle correction with higher MACD levels and stable to higher lows in price. However, on the 21 of September, our turning price low of 9.90 was broken in the first hour of trading and hit a low of 9.12. Our sell stop saved us from a large loss, but was this a sell? We did break what we thought was a wave 2 level in price on the minute trading time frame. Notice that since the low of 9.90 that the entire 5 wave sequence in MACD has created higher lows. Even in the break of the 9.90 level MACD did not make a new low or break its wave 2 level on MACD 30 minute chart. The price motion will not break trend in a five wave sequence when wave 2 level is not broken. The lesson to observe here is, can a break in wave 2 in price be ignored as a sell signal when wave 2 MACD reading is upheld? Follow this new low to find out.
The sell stop signal triggered on SAH on September 21, 2009, was not followed by lower lows after this day. After making this trading level low, SAH tested the low after another 9 trading days of flat price motion, and has since stablized to the upside trading to our old short term profit level. The MACD level was surpased to the downside in the retest of the September 21, 2009 low on October 2, 2009. We could have realized to re-enter the trade on October 2, 2009 as the largest MACD level realized on October 2, was tested in price and MACD on this day. Entering at a price of 9.59, this buy level was tested again on October 7, trading to a low of 9.72. Possible trading profit levels since the new price low would be 11.78 and 13.27. We can see that, as of today, the strength in the stock has surpased its short term level already. Because of the interesting closing price today being so close to our orignianl short term profit level, we could interpret the break in price on September 21 as an irregular correction in price, due to news or market irregularity. |