
In December of 2009 a trading signal was issued on BRCD which was to take advantage of the short uptrend of the B wave of an ABC correction. The initial profit level was met for a gain of 7%, however the longer term profit fell short by 8%.
Looking back on the analysis for this trade, it appears that the B wave of this correction underperformed as well as diverged from following market performance in the QQQQ.
The weekly chart shows the trading price motion from the March 2009 low. The blue line superimposed on the candlestick chart is the QQQQ. As the 6.86 38% retracement level in BRCD collapses, the broader markets continue higher.

The ABC correction was projected to be complete at 5.02. BRCD traded to 4.99 on 5/21/10, but continued to drift lower trading to 4.64 on 8/24/10. The 9.84 price high is currently embedded in a triangle correction, making it a wave 3.
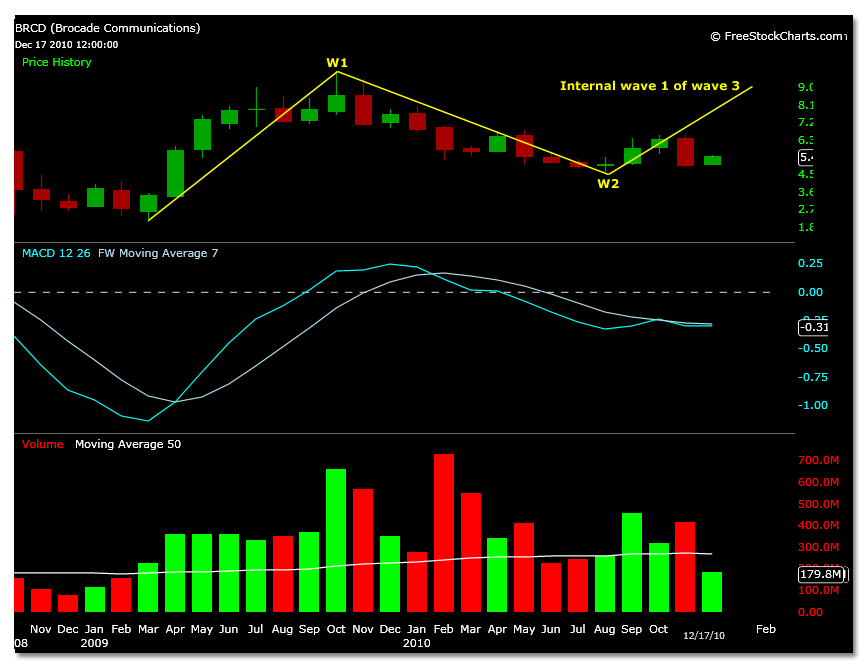
In this analysis the trading set up will not visually follow the previously mapped ABC correction price motion of a wave 1, as that scenario is of a much larger time frame. However, it is worth mentioning that the initial price target of 9.00 is the internal wave 1 of parent wave 3 of this larger time frame scenario (2.05 low to 9.84 read as wave 1) shown in this chart.
Further explanation of the previous disclaimer: The following price targets will be based off a five wave sequence from the 4.64 low to the internal wave 1 of parent wave 5, not an ABCDE wave structure of a triangle wave 4.
This 5 wave structure is sufficient from this price point if the count is based off the larger time frame (2.05 low to 9.84 read as wave 1). The price motion for this structure is visually more apparent in comparison to more current time frames however.
Setting the price target for the current price motion: The internal wave 1 of parent wave 5 target from the 2.05 low to 9.84 (read as wave 3 high) projects to 9.00.
Consider 4.64 – 6.58 (traded 11/10/10) internal wave 1 of wave 1 of parent 5, and its wave 3 price target the wave 5 of internal wave 1 of parent wave 5. This projected wave 3 target calculates to 8.97, matching the calculation of a completed 5 waves of internal wave 1 of parent wave 5 (with 9.84 as wave 3 from 2.05).
As well, internal wave 3 of parent wave 5 (with 9.84 as wave 3 from 2.05) is 11.67. This price target matches a completed 5 wave sequence from 4.64 – 6.58 as internal wave 1 of 1 of parent 5.
So, this time frames price motion analysis, viewed in the chart below in conjunction with the calculated projections, only captures the price projections for the first 3 internal waves of parent wave 5.

If this trend follows through, BRCD could make turning point highs and lows at the following intermediate time frame price targets: 6.37 – 5.75 – 7.43 – 6.75 – 8.97.
Also, should Brocade reach its 9.00 price target remember that this price is also the wave 1 internal of parent wave 3 (2.05 low to 9.84 read as wave 1 high) and could be subject to a correction of up to 100%.