Of course everyone hates the airlines, but as technical traders we do not care much about the short or long term viability of the company, only the short or long term price motion depending on our time frame. Airlines have great volatility and although it can be argued that they are reverse indicators to the oil market. It is much more reliable to NOT use the crude oil market as a set up to a buy signal in this sector.**
What we found working on AMR on Tuesday June 23, 2009:
• RSI well below 30 on strong volume.
• MACD 30min. cross below -.10.
• MACD positive histogram 30min.
• Fibonacci retracement level reached and tested with volume.
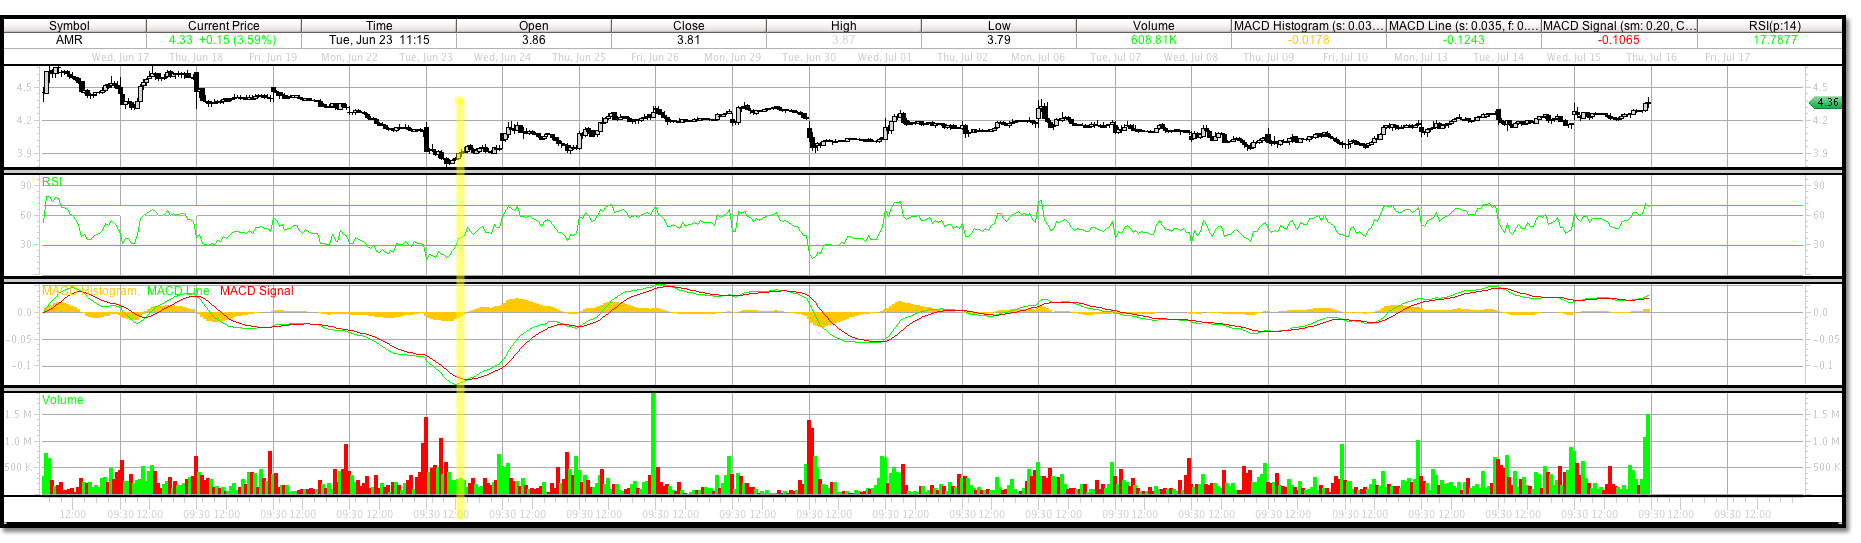
Notice that we first received a signal that RSI was breaking down below the 30 level. A sign that a short term capitulation may be occurring, because the momentum to the downside may be overdone at this level. The next signal we can observe is the increase in volume, confirming the possibility of capitulation.
The next signal and perhaps the most reliable when dialed in properly is the MACD signal. Notice that there is lag in this signal when the MACD line crosses the signal line, but the lag is cut down somewhat by monitoring the positive histogram reading. This lag is a part of many charts, but doesn’t necessarily have to be depending on the calibration. In this chart we are using the standard 12,26,9 signal indicators for MACD.
We further know by computing the Fibonacci retracement levels for this stock that we’re anticipating a retrace close to a 61.8% retracement (using the daily chart) from its previous high off the March 09 lows. A retracement, or successful test of the lows can be sucessfull up to 99.9% of its previous move. The 61.8% retracement level for AMR would be $3.96 on the daily chart. A Fibonacci retracement level can pinpoint where other technical signals are most useful.
As we approached this price we can see that volume increased at this level and found some stability before what appears to be a small wash out sequence breaking through only briefly to rid any further sellers and continuing higher. The price hit a low of about 3.79 for an hour, which would be a 65.8% retracement, before closing at 3.96 the exact Fibonacci retracement level. A trade in itself.
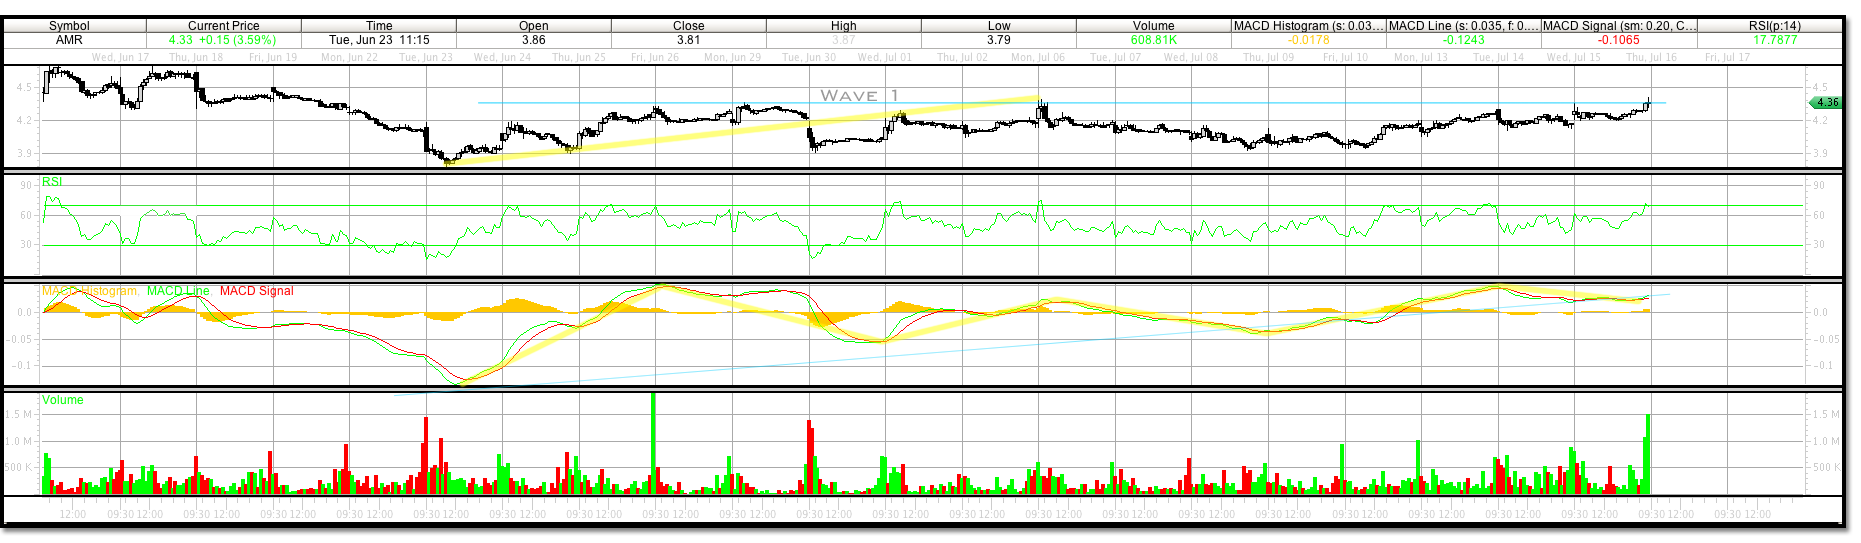
However, if we want to let our winners run and cut our losers short, it becomes imperative that we understand and investigate the Elliott Wave sequence that we are in for the trade in the given time frame. For this trade we will use the 30min chart.
A single wave is most often formed in 120 to 150 frames of price motion, or candlesticks, relative to the time frame you are analyzing. After our buy signal was triggered, a uptrend began which touched highs on both the 7th and 8th day of the formation. 7.5 days on the 30min candlestick chart represents 120 price bars. The light yellow rule shows the trend for 8 days. If you sold out at the top of wave1 using this diagnosis you would have completed the first trade of the five wave sequence available. Unless you are going short during corrections, in which there are more trades to be had. We will not be going short at ssttrader.com.
The upper resistance is shown as a thin blue horizontal line across. Now we look for the formation and confirmation of wave 2 and the beginning of wave 3. While the count of price bars can be used to delineate wave formations, it is not always a perfect signal. In fact, time frame is the only part of price motion in the Elliott Wave that can not be mathmatically drawn upon for a specific conclusion or forcast. However, if a close above the horizontal resistance line is achieved with out a violation of the original buy signal low, wave 3 will form and wave 2 will be complete. Until then a wave 2 consolidation is in process as long as the low of wave 1 is not broken. We look to Fibonacci retracement levels to confirm the correction wave of wave two and the turn to wave 3.
Upper resistance shown as a thin blue horizontal line was broken on Monday June 20, 2009. This should have confirmed that the correction wave 2 has completed as it hit a volatility low of 3.91 on Tuesday, June 30 2009 and tested that low at 3.95 on the July 10, 2009 before heading higher for another 7 days or about 120 price bars to a new resistance level at our first profit level of 4.60. However our wave 3 target level will be 5.16 or 162% of the wave 1 length plus the level low of wave 2.
The current correction after reaching our first profit level due to prior resistance (and possibly earnings reports) could be over already after reaching a low on July 21, 2009 of 4.24. But, a 62% retracement of the Wave 3 move would be 4.18. Now that our wave 3 has formed we can move our stop loss up from our wave 2 correction stop loss of 3.78 to 3.90 if we are to continue with the initial trade throughout the wave cycle on the 30min. chart.

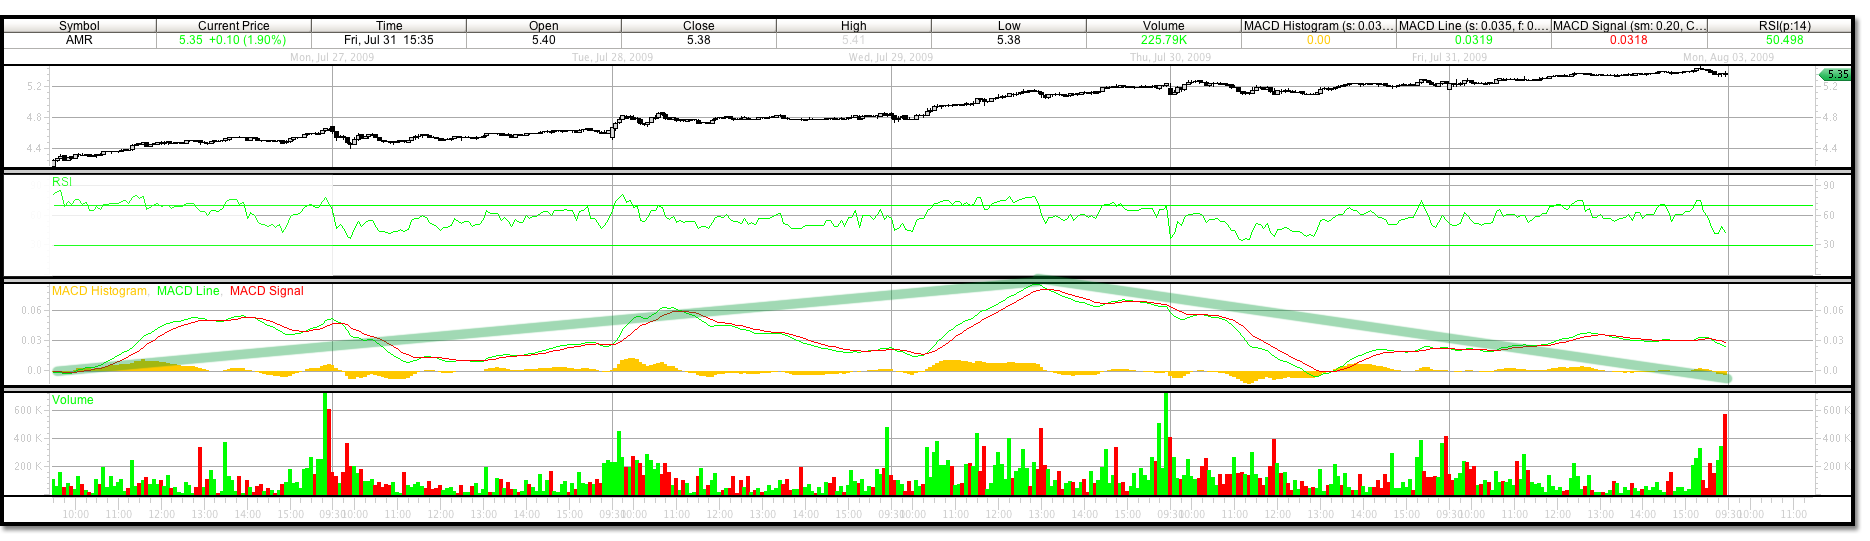
On Wednesday July 23, 2009 AMR corrected to 4.08. A 62% retracement of the wave 1 move from 3.79, to a high of 4.64 where we had a MACD cross above the zero line, would have been 4.11. From this low, on Wednesday July 29, 2009, AMR reached our profit level of 5.16 quite handedly. The next two days AMR continued to climb to a high of 5.46 on July 31, 2009 and closed at 5.35. Previous high resistance may play a part here. Look for resistance at the 5.35 level which was a prior high on June 2, 2009 and the top of Wave B in the corrective ABC wave prior to our turning low of 3.79.
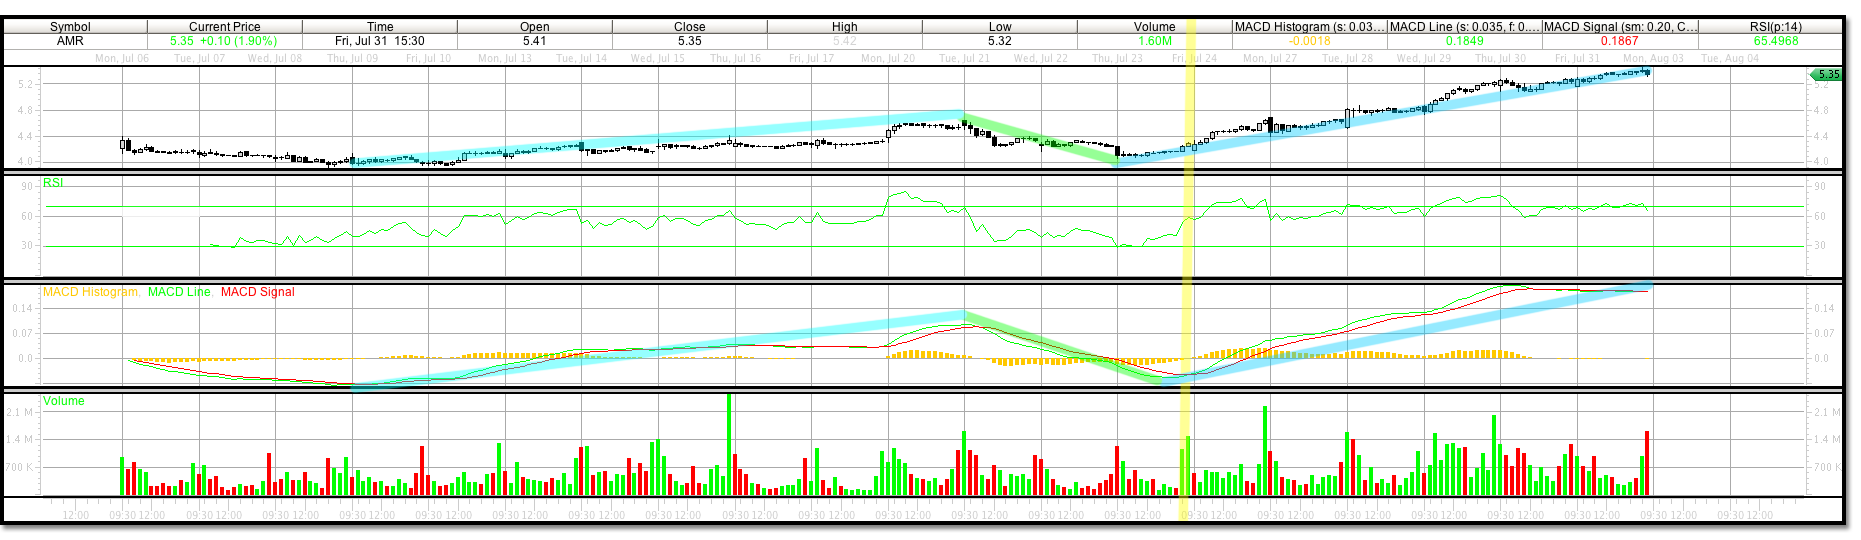
The current high on July 31, 2009 also represents the 7th day in the uptrend on a 30 min chart, or 120 price bar trend, which could signal the end of wave 3 unless wave 3 continues. Notice the flattening of the MACD and trend of the Histogram going into negative territory. Also notice a bit of divergence of MACD and price movement on shorter time frame charts. This 5 minute price bar chart shows that lower lows and lower highs were being made in MACD as AMR continued to make higher highs in price. This could be a sign that the trend is coming to an end.
Unless the trend for wave 3 continues we will look for a price retracement of 50%, 62%, and 70% with a new sell stop level of 4.07. Look to buy back into the trend at a wave 4 turn at 4.77, 4.60 and 4.49. If we turn at a 62 percent retracement, look for the top of wave 5 to form at 5.97.
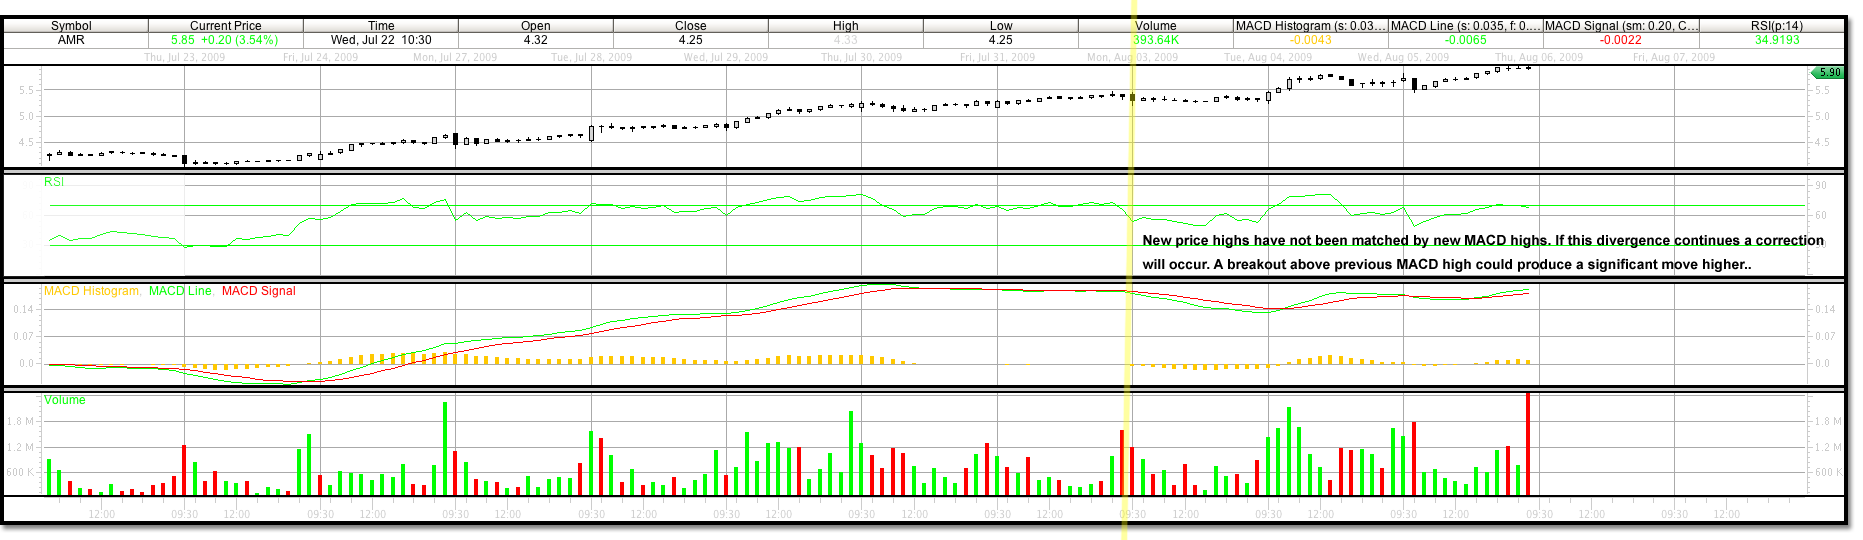
AMR hit a high of $5.95 today on August, 5 2009. This exceeds our previous wave 3 targets and exudes the power of a wave 3 Elliott Wave trend. AMR’s wave 3 trend is just pennies away from a 262% move of wave 1 which would be $6.017. There still is signs of some negative divergence in the charts, however this is why trading time frame is key, there are subsequent signals being triggered on longer time frames and consequently new buyers are coming in.
Furthermore, the 30min chart Elliott Wave sequence that we are tracking specifically in this trade, although also starting to show some divergence, has not crossed its MACD zero line and it’s price continues higher. If a 262% move of wave 1 to $6.017 does not create a Fibonacci retracement then we could continue with wave 3 further and anticipate upside resistance at the next previous high of $6.50 that was hit on May 6, 2009.
AMR corrected like we were anticipating on Friday August 7, 2009 after hitting a high of $6.11. MACD 30 min chart made a prolonged crossing on Monday the 10th and continued to cross the zero line on the 11th coming within 2 cents of a 38.6% Fibonacci retracement level of 5.31. This is the correction wave 4 forming.

MACD did make a higher high after 3 consecutive lower lows in the 5 min chart after hitting this retracement low, however the low has not been tested yet on the MACD. Often there is a retest. If not significant in price motion than easier read on the MACD before a meaningful move in one direction or another can be judged. The higher high could be the B wave of the ABC corrective wave 4.
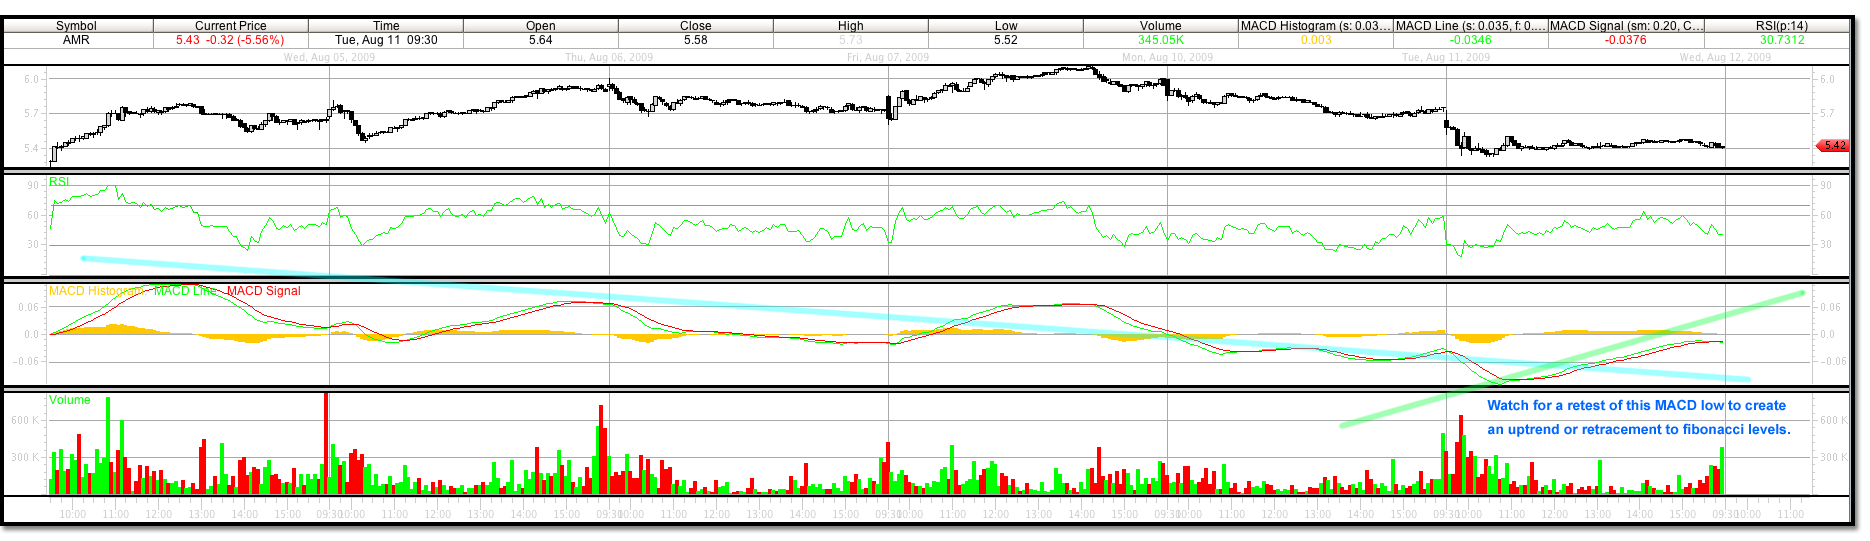
The C wave of wave 4 may reach lower Fibonacci levels unless it is a flat retest. If C breaks the low, anticipate the turn of wave 4 at 5.31 (38.6%), 5.08 (50%), and 4.83 (61.8%). Our wave 5 target will be 6.8653 for the 30min chart 5 wave sequence.
Friday August 14, 2009 we saw the C wave of wave 4 correction begin to form. A break of 5.30 retracement level confirmed this although the 38.6% retracement level held for the close at 5.34. Today, Monday August 7, 2009 the market as a whole made a correction and we found that the closing retracement a possible flat bottom correction of AMR wasn’t going to hold.
However, it did find support at its exact wave 4 Elliott Wave level, if you measure a wave 1 magnitude of 0.85, wave 4 is at about 3.96. Today was a good day to start a small percentage of your position if you want to re enter the trade and believe that wave 5 will reach its target. Look for 4.83 (61.8%) for the rest of the week, possibly the 4.64 level which would be a retest of the our 30min wave 1 top. A break of this level could be bearish. If a new low is made from our 3.96 level watch for a retest on MACD to hold. The 30min chart still does not show a MACD signal line crossing buy signal.
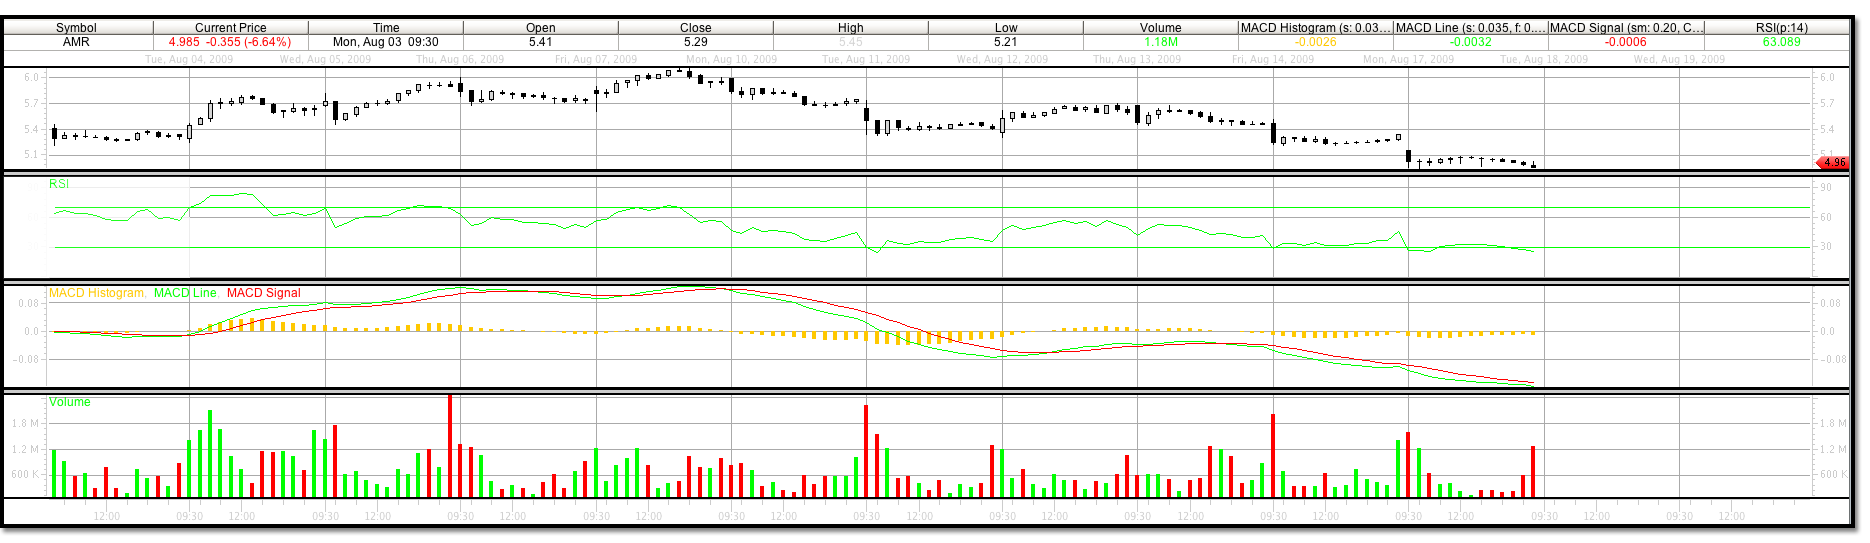
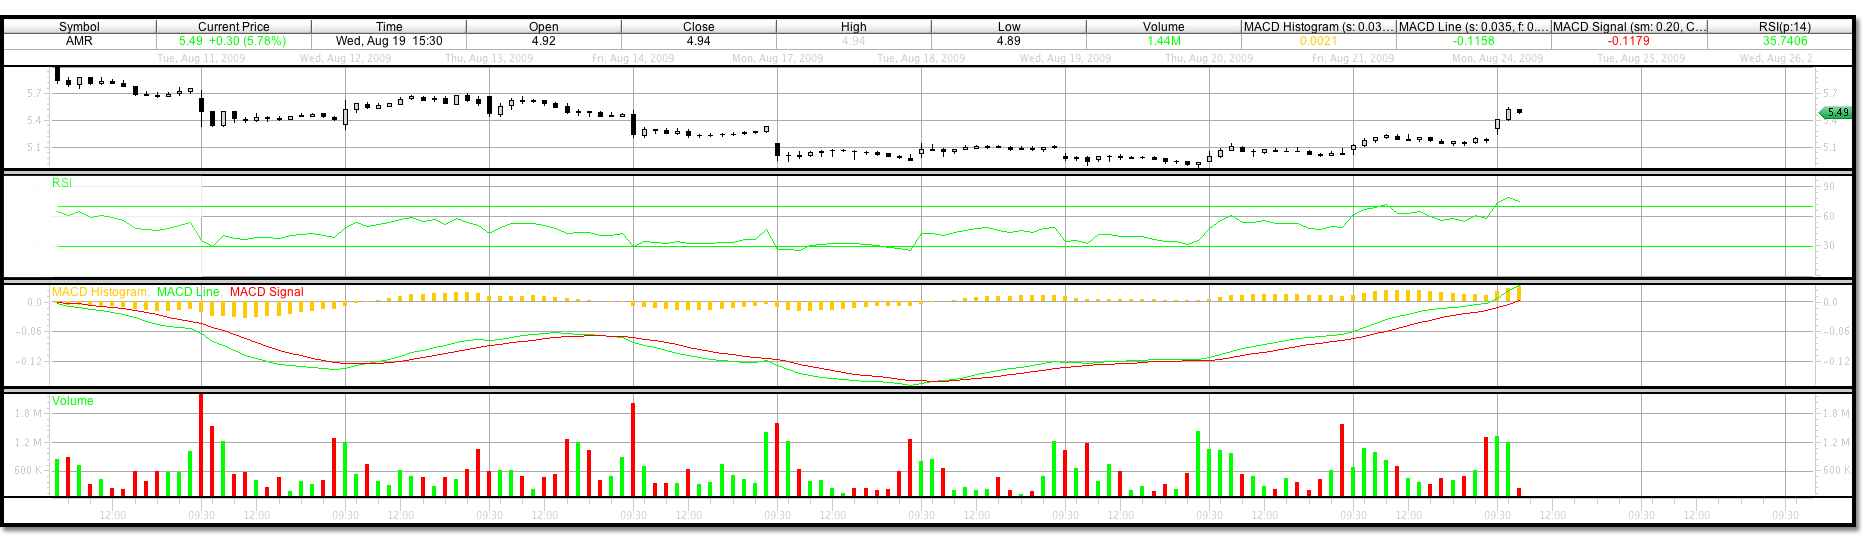
It appears that the C wave of wave 4 reached a low of 4.89 on August 19, 2009. Just 0.05 off our target 62% retracement level of 4.83. The A level bottom at 5.33 on August 11, the B level top at 5.70 on August 12, and the C level again on the 19 of August at 4.89. The 30min. MACD signal crossed at about 5.00 on August 18 using the standard MACD settings. On the 30min time frame this wave 4 could most certainly be over and a breakout to wave 5 levels underway if the highs of 6.11 are broken.
As this 30min 5 wave sequence comes to an end be sure to keep an eye on breakouts in larger time frames that may induce a longer trend higher. However, remember it is extremely important to know the time frame you are trading in if you are to follow an Elliott wave sequence for trading signals.
Looks like our 4.89 level was good. And AMR has quickly moved to the upside. Looking at the chart we see that wave 1 of wave 5 on the 30 min. chart went from 4.89 to 5.54. This chart below shows the 5 wave sequence within that wave and the turn to a corrective wave.
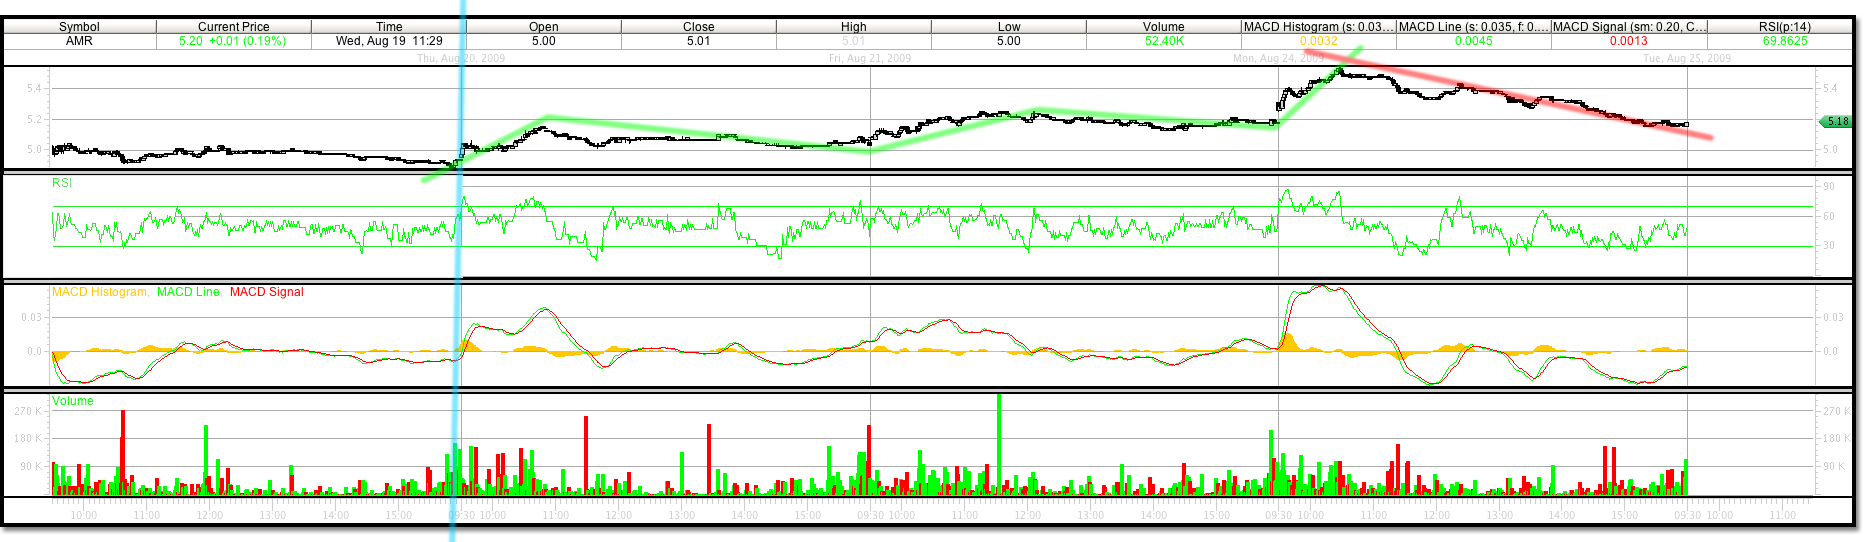
The corrective wave from 5.54 to 5.15 was almost a exact 62% retracement of 5.137. See within the corrective wave the 5 wave sequence in the chart below.

Today, August 26, 2009 we hit close to a wave 3 target of 5.87. This is wave 3 of the parent wave 5, 30 min. chart. Anytime we generate a wave 1 we can recalculate our estimates to other waves. Wave 1 of the parent wave 5 was bigger than anticipated, and it is possible that AMR could top out in this trading time frame at 7.2417 instead of 6.8653. After hitting the high today of 5.87 we should pull back between 5.66 to 5.52 and then continue higher to 6.48.
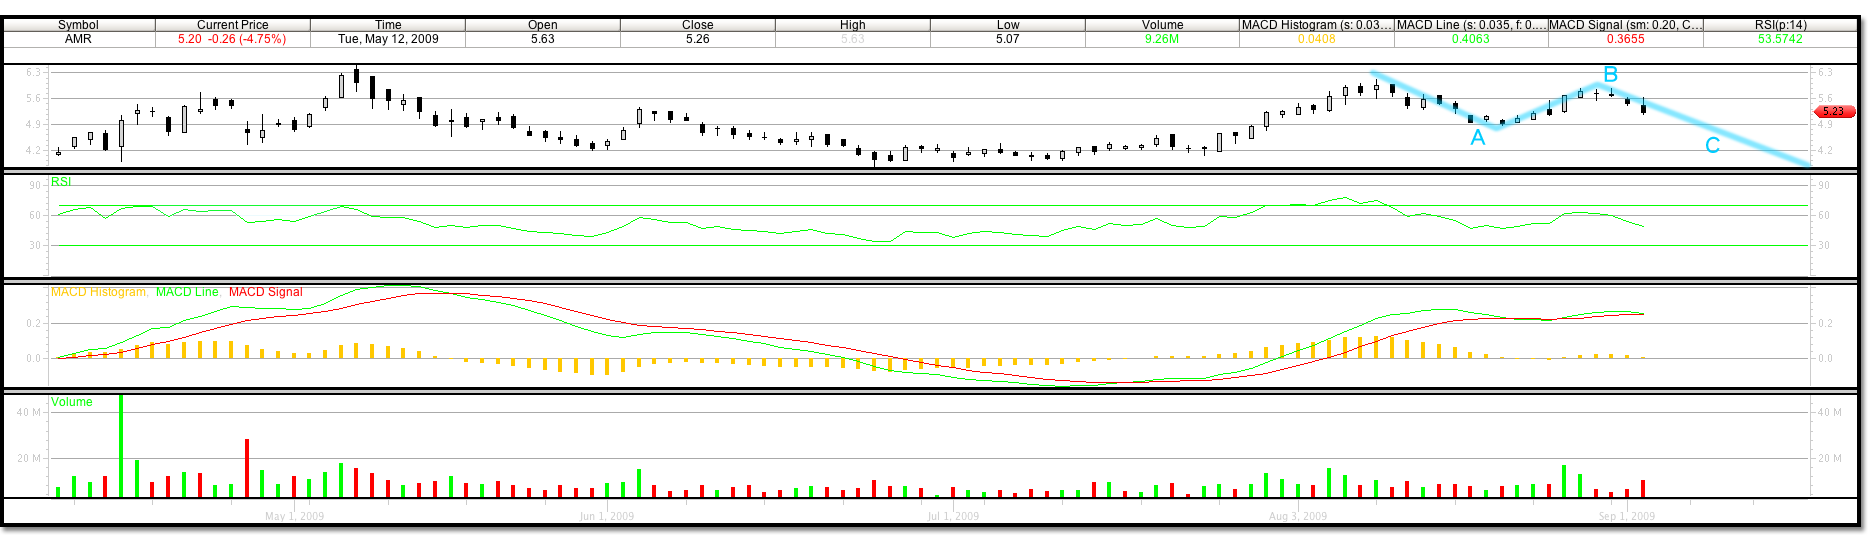
Today, September 1, 2009 we hit a trading low of 5.17. This latest move has not followed our anticipated wave formation. Our wave count must have been off, and the trend could have changed. Our wave 1 magnitude appears to have been too large. After this adjustment a wave 4 low would have been 5.15 if we re count our waves using the latest high of 5.87 as a top wave 5 count. This correction can not continue past the 5.15 level if the uptrend is to continue. This is our sell stop for this particular trade. There will be a lot of pressure on this level if the market deterioration continues.

The support levels may revert to the latest uptrend having topped out at the 6.11 trading high, from the 3.79 trading low. A range that should continue to a strong daily wave 3 uptrend. However, a 38% Fibonacci retracement from these figures would give us the 5.22 trading level we saw today and the wave 4 support level we have right below.
Or, this could continue into a large C wave correction on the daily chart to a 62% Fibonacci retracement of 4.67. The A level trading 6.11 to 4.89, the B trading from 4.89 to 5.87, the C still to form. If this stock breaks the 5.15 level we will not continue our analysis of this particular 30 min. trade to the upside. Look for new buy signals at these lower levels and continue to use your system of trading to follow your trade.