|
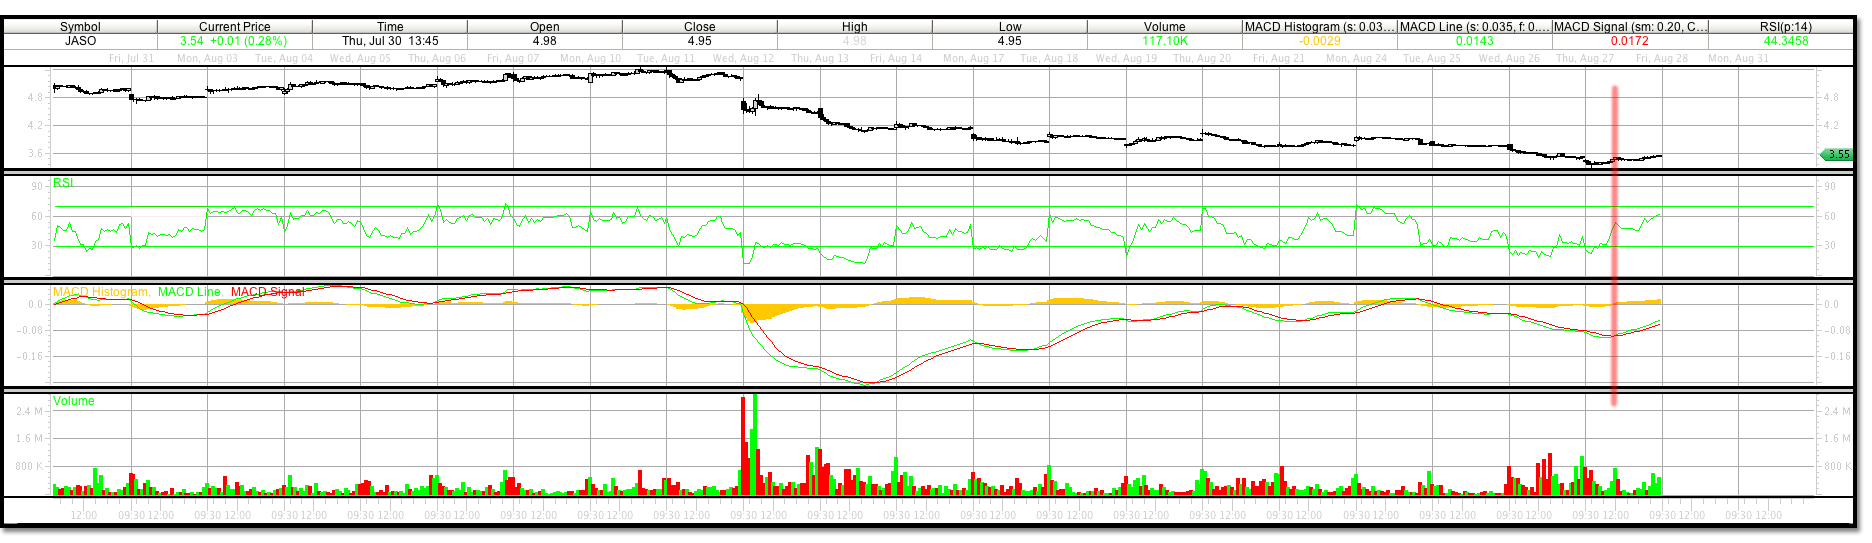
Buy trading signal triggered on JASO on Wednesday August 26, 2009**. |
| JASO- Buy signal triggered on JASO on Wed. August 26, 2009* | |
| Trading signal for 15 minute price bars | |
| Buy price: $3.53 | |
| Sell stop price: $3.40 | LEVEL HIT – August 27, 2009 |
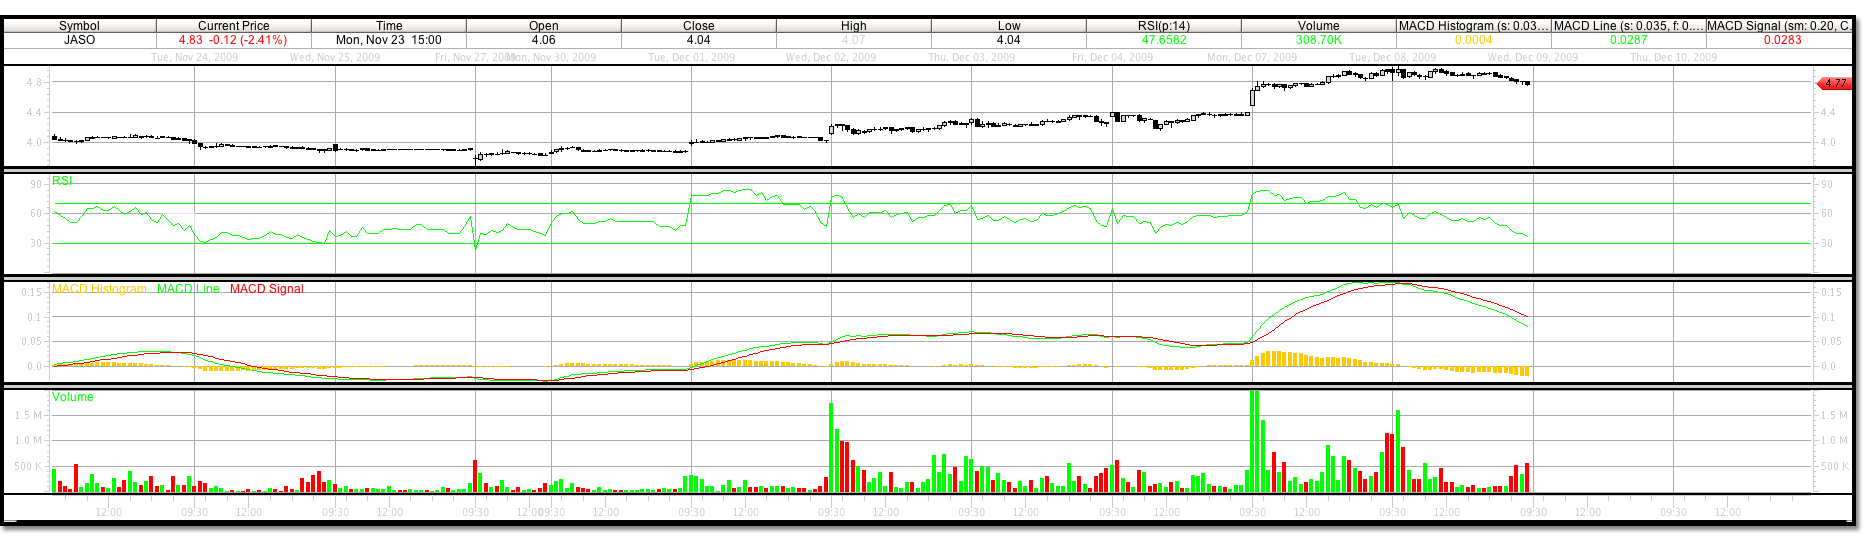
| Short term profit level: $5.00 | LEVEL HIT – December 8, 2009 |
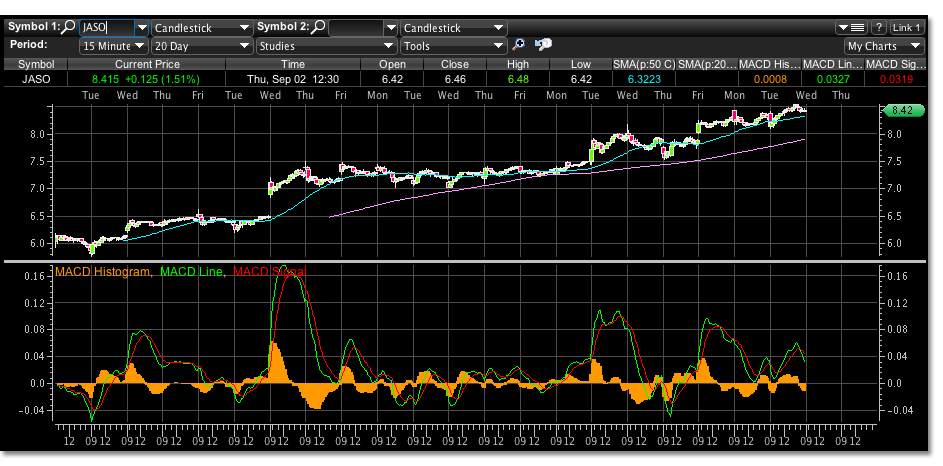
| Long term profit level: $8.50 | LEVEL HIT – September 28, 2010 |
| Current Google® Finance Quote |
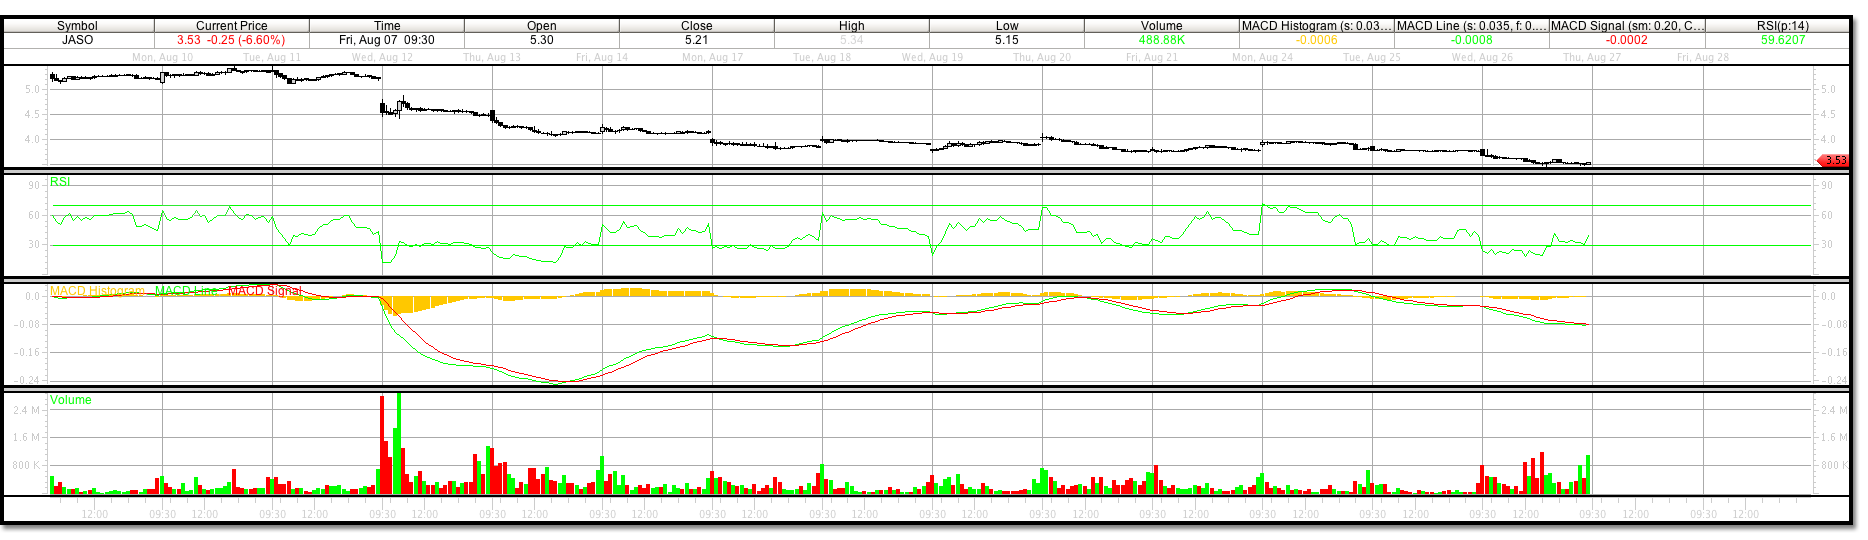
Sell stop level of 3.40 hit August 27, 2009. Stock reversed at trading level 3.31 and is now trading close to positive on the day. Was this sell signal correct, was our wave 4 retracement level miscalculated? MACD had not crossed in the signal time frame until this latest correction. Reference the MACD signal cross in the chart.
This signal may have been premature. A stock that gaps lower than the previous day close to a new low, then trades higher to close positive on the day is often an key intra day reversal. Watch JASO retest this reversal and trade appropriately to your risk tolerance. Stock Signal Trader will continue to track the short and long term profit levels.