
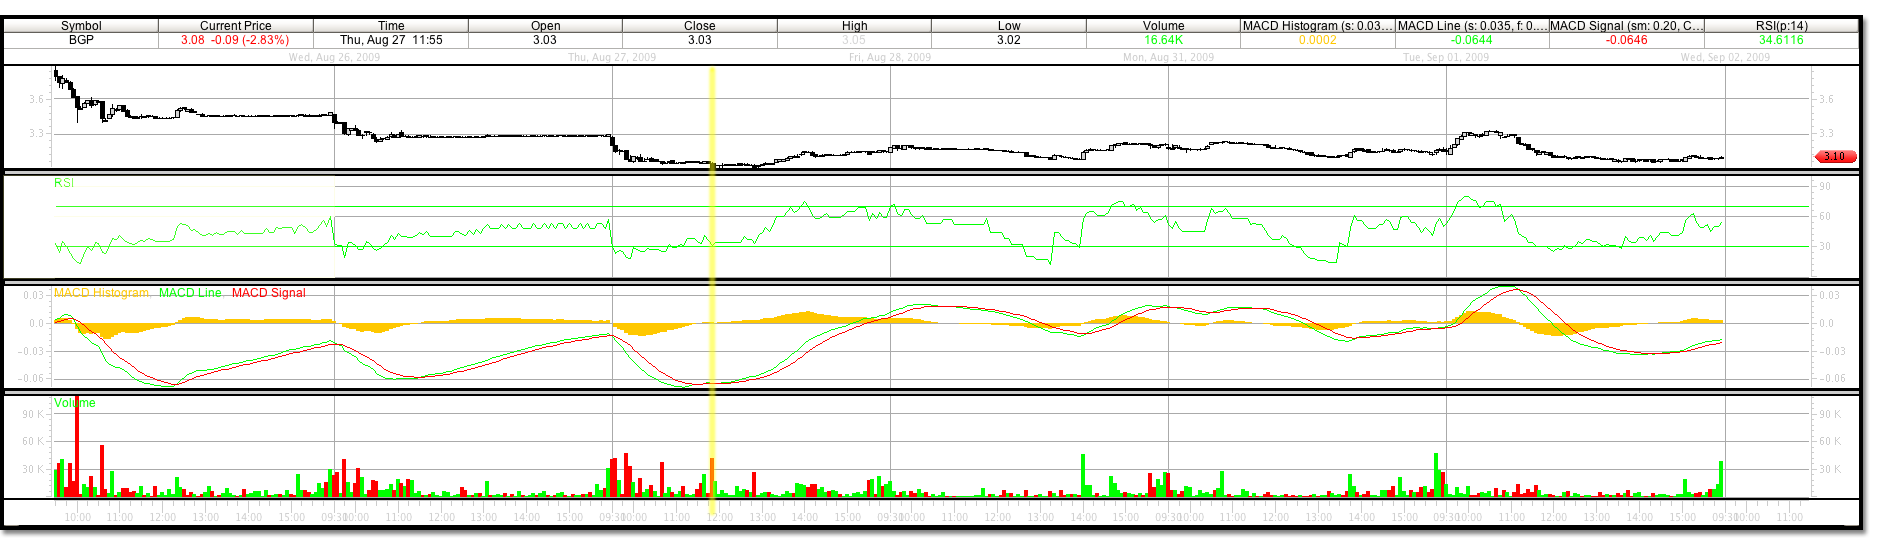
BGP hit the stock scanner today August 27, 2009 right away at 10:00am as it dropped more than 6% to a trading low of 3.02.
The 30 min. 20 day chart appears to be in a downtrend. We will keep the research on this trade short initially to try and exemplify how you might work on the fly in real time as you analyze a stock signal.
First pull up the said trading chart. Recognize the cyclical progression and magnitude of the chart. Visualize or chart a line connecting the highs and the lows of the price motion. Some people like to view bollinger bands to do this. I don’t use bollinger, but it could help chart the trading pattern if you cant see it.
Also, it is important to view a trading chart at a consistent size. Size being the actual measurement of the chart on the screen should be kept consistent. As long as its kept proportional your analysis should be consistent. However, visually it can be said that an index card size/proportion should be used to view a trading chart.
Looking at this chart, right away in the middle, we notice a three wave uptrend from August 17 to the 25, 2009. Then a five wave downtrend from the 25 to the 27. This stock is in a downtrend. Uptrend wave sequences start with 5 wave uptrends and 3 wave corrections. Up on 1, correction on 2, up on 3, correction on 4 and finally up on 5. Then the process repeats or reverses. Reading this 20 day period in BGP, at the 30 min. time frame, it appears that we may have just finished a 5 wave down trend.
This could mean that the trading low of 3.02 after a gap lower open could signal a reversal higher for at least 3 waves if the down trend continues. In order to find out if this is the end of a larger waves downtrend or just an intermediate wave to continue lower we would have to analyze a larger time frame.
Scenario 1:
If the intraday low to the traded closing price on August 27, 2009 were used as a magnitude of wave one of a three wave correction to the upside and the 30 min. MACD which is very close to crossing does so, we could set a short term trade from 3.02 to 3.33 level.
Scenario 2:
Until this stock reverses that pattern, 3 waves up 5 waves down, it could be headed to the 2.00 range were it will test its daily chart wave 4 trading low of 1.96 on May 14, 2009. If it does test this level successfully, a powerful monthly wave 3 could form. If so, BGP could trade to wave five level of 15.31 on a monthly time frame with a duration of approximately 3 months per wave.
No trading signal was given to buy, however stock signal trader still tracked the potential short term move. It turned out to be a profitable scenario and worth a short analysis.
We notice a three wave uptrend from August 17 to the 25, 2009. Then a five wave downtrend from the 25 to the 27. This stock is in a downtrend. Reading this 20 day period in BGP, at the 30 min. time frame, it appears that we may have just finished a 5 wave down trend.
The trading low of 3.02 could signal a reversal higher for at least 3 waves if the down trend continues.

Since this is such a short trade we are just going to make an quick example of the math you can use to create price targets of your own. Being in the correct wave is the key to having this sucess.
The MACD in this chart is not quite dialed in properly. If you enjoy trading a specific stock, try using different MACD settings to create less lag in its siganls. The signal to buy on the MACD did not come unitl the open the next day on the 30 min.. If we were to have waited for this signal we would have had to buy into the trade at wave 2 and this would have decreased our profits quite a bit.
MACD is one of many signals that you can use to try and pinpoint exact turning points in stocks. Smaller time frames should always be used in conjunction with your trading time frame to hone in on that turning point price as the faster the time frame the quicker the trading signal will reveal itself. The key is to ignore the false positives and act on the trading signals that are in your favor. This chart below shows a 5 min. trading time frame. The MACD here crosses exactly at the 3.02 low for the day.
Measuer the magnitude of wave 1. We anticipated this to be the low of the day to the high made on that same day of 3.16 made after the trading low. However, the magnitude of wave 1 can not be exactly calculated until we are sure wave 2 has formed. Speculation was used to set up a very short term trade. Buy price was 3.02. Sell stop price 3.01. Magnitude of wave 1 was .14.
We anticipated a short 3 wave sequence higher from this low. If we waited for wave 2 to form before entering the trade our best entry point would have been 3.08. You can see that 3.08 was the retest of the beginning of wave 1 and were the MACD re crossed its signal line to the upside after signaling sell at the top of wave 1.
If you take the known magnitude of a wave 1 and multiply it by 2.236 in addition to the wave 1 price entry point level you will have calculated wave 3. Which was our anticipated price motion target due to the wave sequence we beleived to be in. If you do this math you get 3.33304, which when rounded was traded today September 1, 2009.
These calculations can have a percentage of error and should be used with this understanding and your own trading strategy dicipline. In order to find out if this trading low was the end of a larger waves downtrend or just an intermediate wave, we would have to analyze a larger time frame.**