
|
Buy trading signal triggered on ZSL on September 8, 2009**. |
| ZSL- Buy signal triggered on ZSL on September 8, 2009* | |
| Trading signal for 30 minute price bars | |
| Buy price: $5.60 | |
| Sell stop price: $5.49 | LEVEL HIT – September 11, 2009 |
| Short term profit level: $6.10 | Reverse Split 10/1 – April 15, 2010 |
| Long term profit level: $6.45 | Reverse Split 10/1 – April 15, 2010 |
| Current Google® Finance Quote |
|
The sell stop signal was triggered on ZSL on September 11. We continued to keep track of this ETF especially as the market has begun a correction. This double inverse ETF could be a good day trading vehicle if the silver market continues to correct. The chart below illustrates that even though your sell stop is signaled and minimal losses are encurred, if your strategy was correct it could be advantageous to watch for new trading levels even as your trade goes in the wrong direction. Alot can be learned in confidence and strategy as you watch winning trades develope from loosers. |
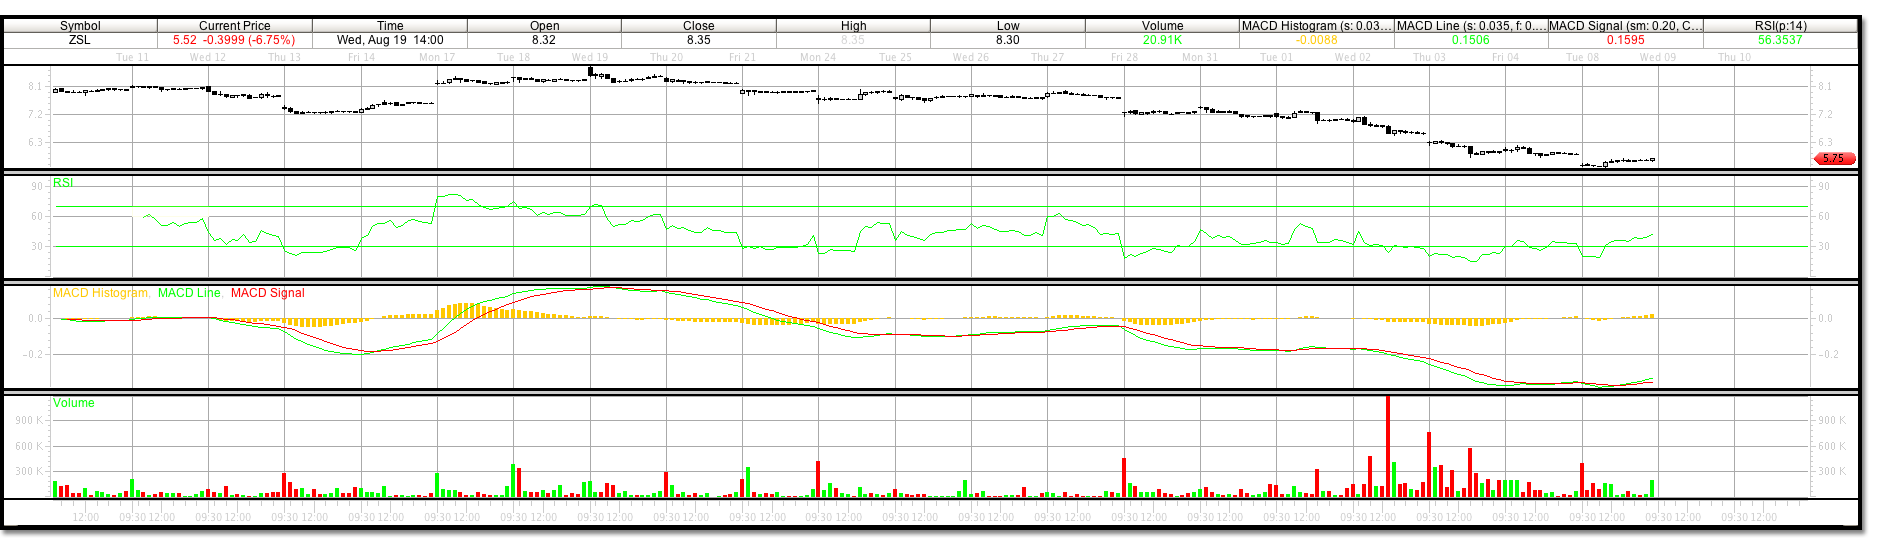
Lets look at some of the trading levels in ZSL from September 17, 2009. This is a 5 minute trading time frame. The 5 wave Elliott Wave that follows is easy to calculate and exactly what we are looking for when setting up a trade. The red line in the chart, compared with past chart levels from September 8, 2009, shows that the MACD levels exceeded the preceeding levels that we called wave 3 in the past. When we see a large wave in a trading time frame we can anticipate that it may be a wave 3. If this level is broken however, then the trend is not at a reversal point but continuing, and our wave count is off. Reasons could be, counting an internal wave in a smaller duration or trading time frame due to volitility.
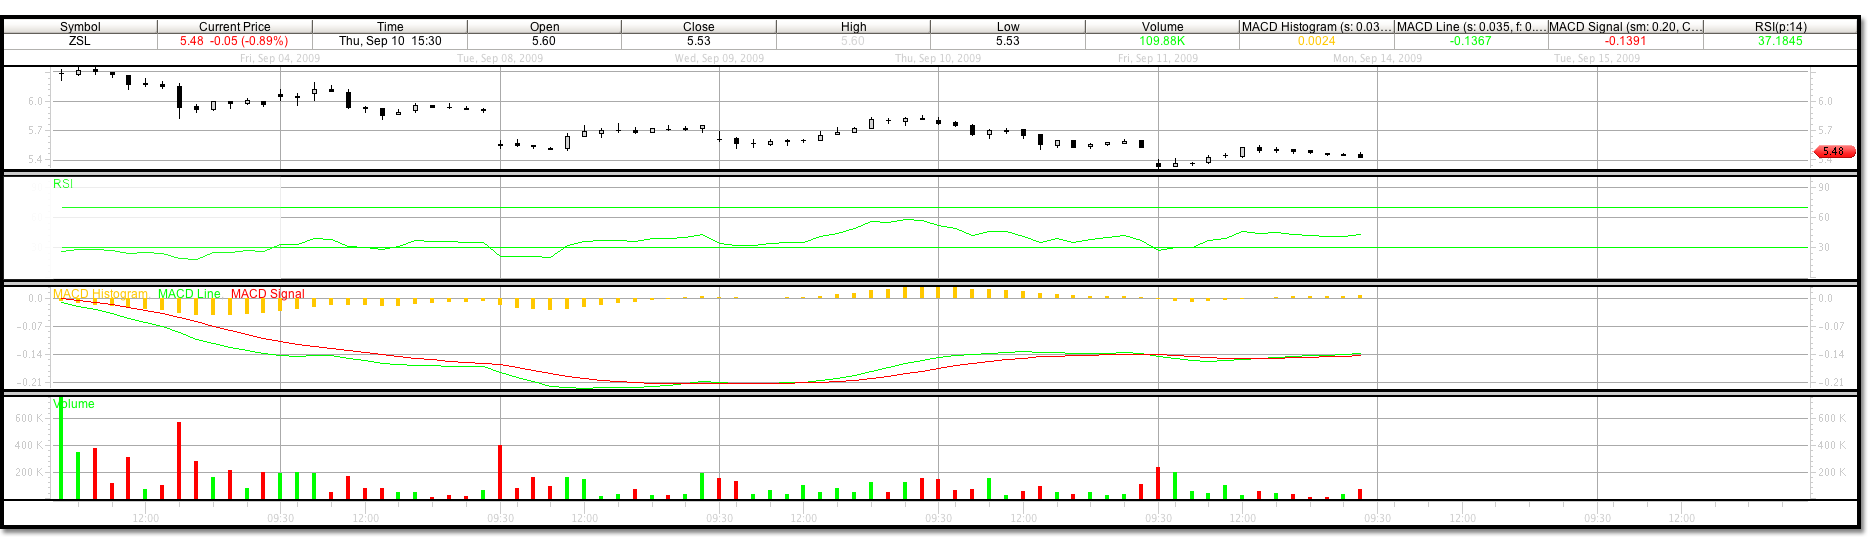
If we read this new lower cross as a wave 3 and track it as we have in the past, it shows a turn on September 16, 2009. Wave 4 MACD begins a divergence from declineing prices and crosses again to enter wave 5 on the morning of September 17, 2009. ZSL trades makes a low of 4.94 at 10:50 on this same day. Notice how the MACD level flattens and shows zero velocity in price motion, and the MACD doesn’t make a new low past the wave 3 MACD. Now follow the blue line in price motion. From 4.94, MACD crosses the zero line and makes a high of 5.17. The MACD crosses at this price and trading tests this low at 5.07. MACD remains above the zero line and crosses again as prices trade higher. This is our clasic wave 2 retest. When you view this you can set buy and stop loss levels of 5.07 and 4.93, moving your stop loss higher as the trade develops.
We now have the magnitude of a wave 1 in the 5 minute trading time frame and can calculate short and long term profit levels. Basically our wave 3 and wave 5 price levels. Wave 3 level would be 5.45 and wave 5 level would be 5.77. The peak on September 21, 2009 in ZSL hit this short term level trading to 5.50 then corrected to a wave 4 level of 5.08. A penny above our wave 2 level low. The reversal from this price is also a strong buy signal. If we had broke the wave 2 level low of 5.07 in our wave 4 retracement the trade would be a sell and our stop loss would have kicked in. Today, September 24, 2009 the stock hit a top of 5.75 and has traded to 5.79 in the after hours. This trade could develope further in a larger time frame, or if we want to follow this trading time frames wave sequence look for Fibonacci Retracement levles from the turn of wave 5 when it develops.
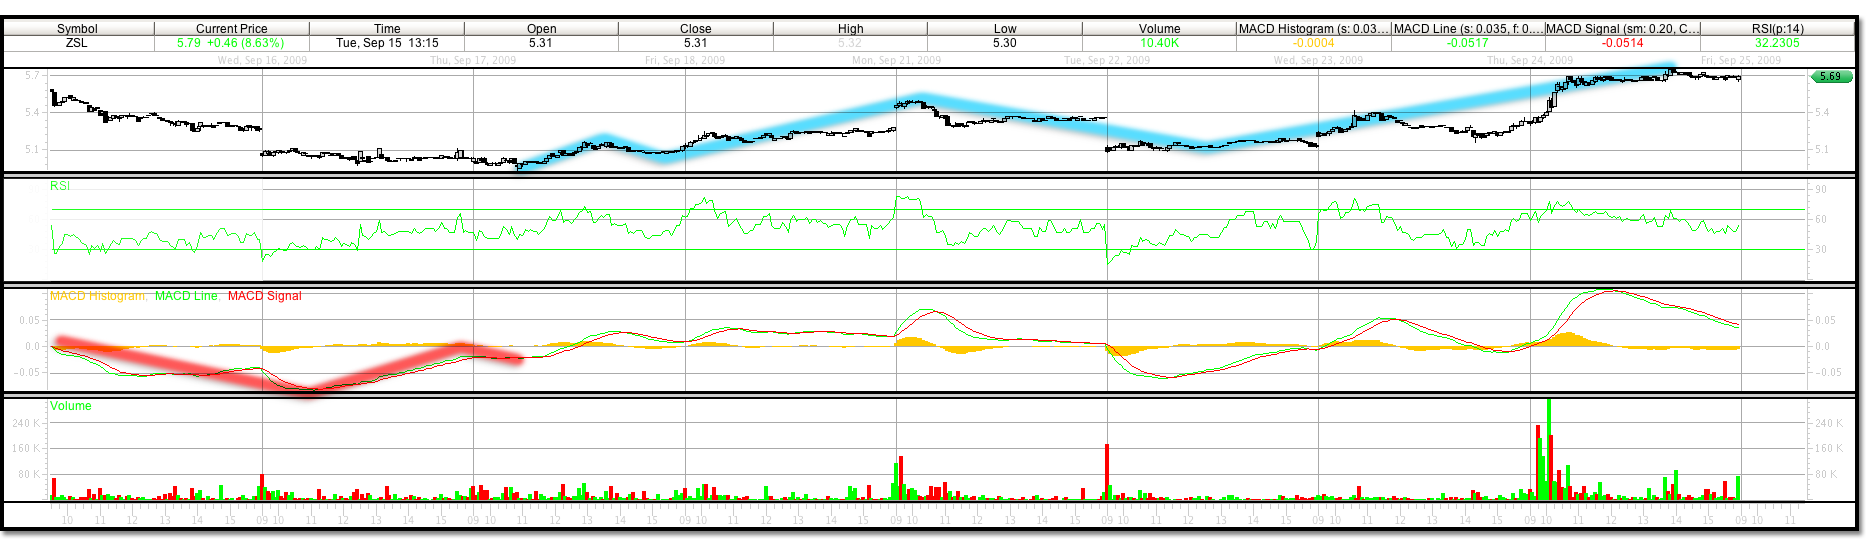
By looking at the 5 minute chart below, we easily traded to our 5 minute wave 5 target on September 25, 2009, hitting a trading high of 5.89. This is shown with the green line on the left. This trading high also figured out to be the near term turning point in ZSL. We can see by analyzing the MACD trend that there is 3 wave correction apparent as ZSL trades towards a retracement level. The final green line to the right is the low of today. If this low and the subsequent higher 30 minute trading time frame wave 2 level holds ZSL could trade higher.
ZSL Chart Analysis 5 Minute Wave 5
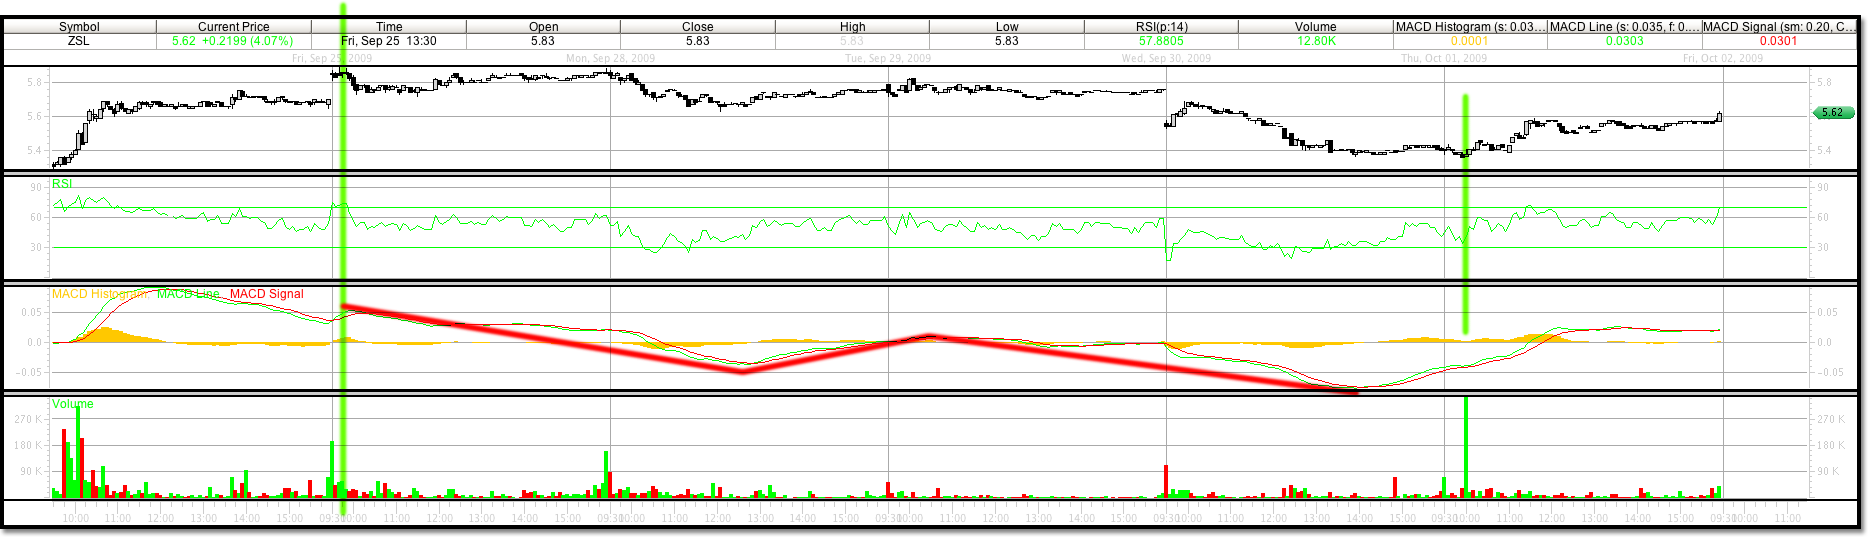
As we look at the stock today and the chart below, we can see since this high, ZSL traded within about .05 cents to a .618 Fibonacci Retracement from its 5 minute 5 wave trend. ZSL traded to a low of 5.36 and closed at 5.62 on October 1, 2009. The 30 minute trading time frame candlestick chart below shows that ZSL may be beginning its 30 minute wave 3 move. This wave 3 move could bring ZSL to a trading high of 6.19 and a wave 5 level in this time frame of 6.96. These numbers may be adjusted as the trend continues depending on the strength of the intermediate trends. At this point in a 30 minuted trading time frame, if we were to have entered the trade today at the low,the sell stop should still be 5.07 the nearest wave 1 retest in the 30 minute trading time frame. Less aggressive traders may want to use todays low as a sell stop 5.35.
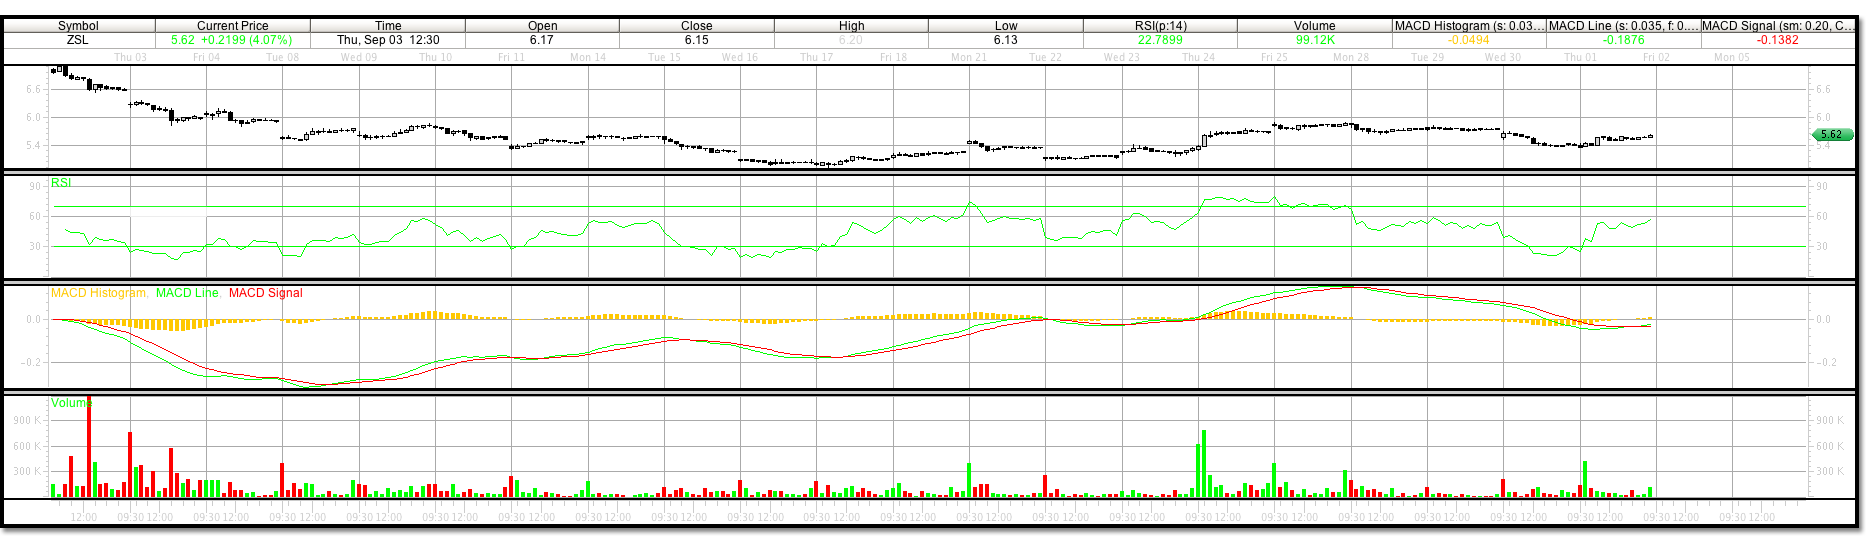
ZSL Chart Analysis 30 Minute Wave 3
As of today, October 6, 2009, the rebound in ZSL from the 4.94 level can be dismissed as an ABC corrective wave in the downtrend, not a larger reversal to the beginning of an uptrend for ZSL. The much lower MACD level on this latest move suggests that the most recent sell off was a wave 3 in a five wave downtrend and is still yet to be completed. The trading in gold and silver today was quite dramatic and there is a chance still that the move to the upside in these commodities will continue even though the trade is crowded. Short term traders that continue to monitor ZSL for turns should participate by selling into the C waves corrections until the technical indicators show a 5 wave sequence from the turn holding support levels. Sell stop levels in any future anticipated turns should be respected.
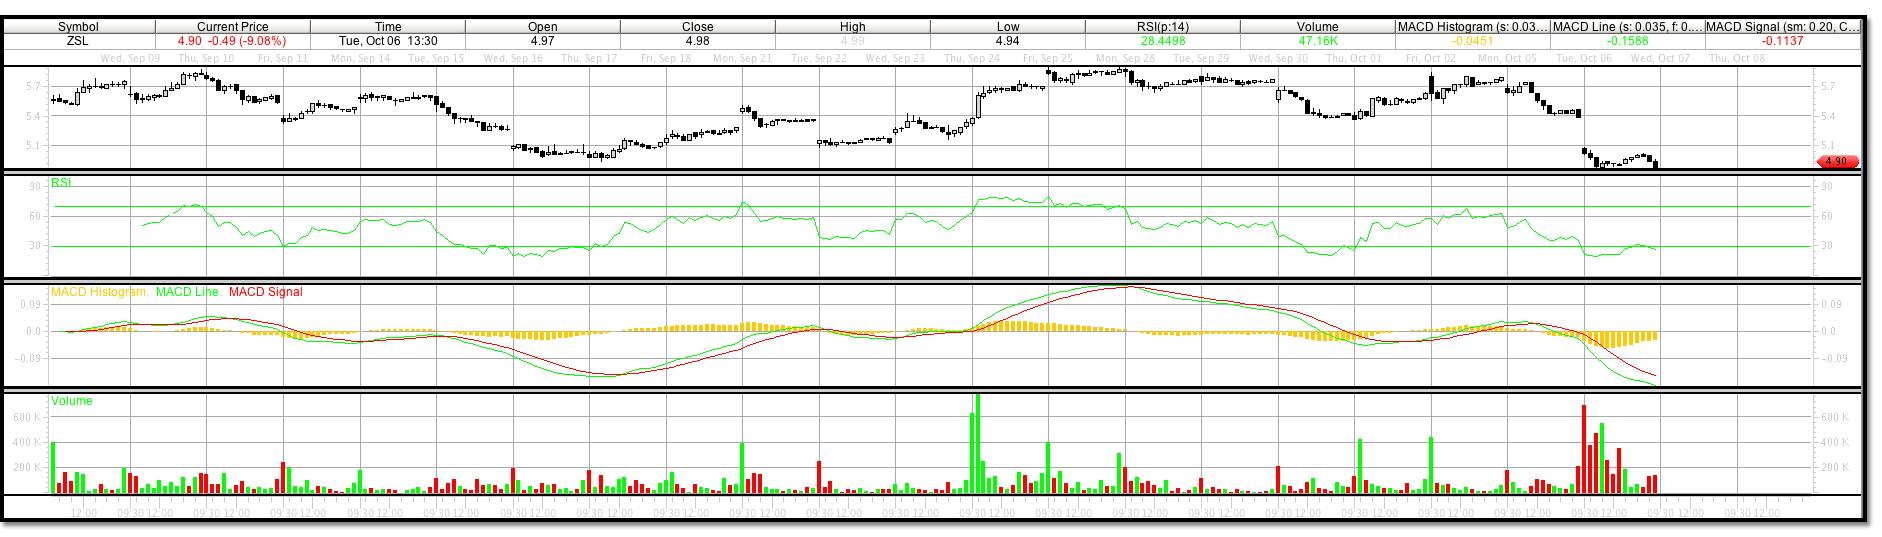
ZSL Chart Analysis 30 Minute Wave 3 Sell Off
Today is Thursday April 15, 2010. ZSL along with many other etf equities are under harsh scrutiny. In this case ZSL has just executed a 10 for 1 reverse split, which has apparently triggered our profit targets. All joking aside it is easy to see by analyzing many of the etf’s available today, not just Proshares, that there is at time legitimate concerns about the tracking capabilities and efficiencies of the double bullish and bearish funds performance. Many funds are being sued with allegations that the funds do not perform as described.