AK Steel Holding Corporation is a producer of flat-rolled carbon, stainless and electrical steels, and tubular products.
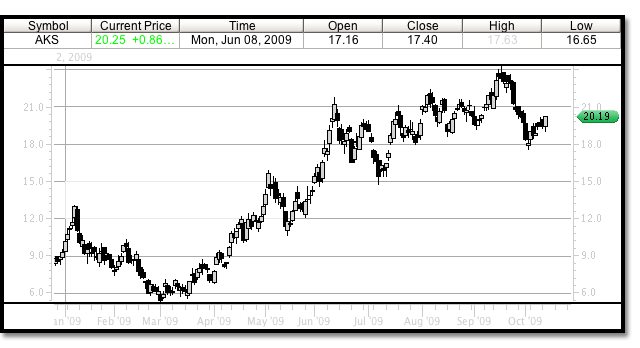
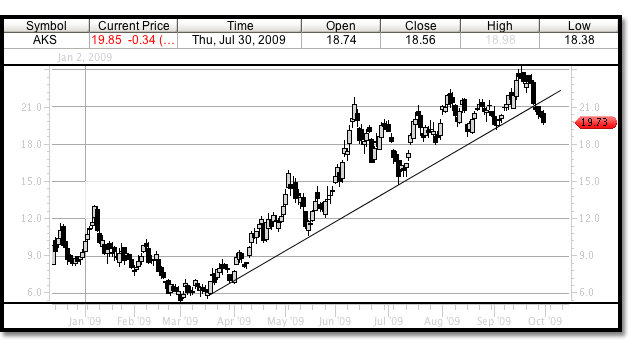
Stock signal trader does not produce sell or short signals outside of short ETF’s. However, sometimes the signals that are generated can be sell signals. This may be the case with AKS. Although at this point it may be poised for a short trade higher, by looking at this daily trading chart below, it does appear that a significant trend line from the March lows has been broken. Anyone looking to buy AKS in the near term trading range should be aware that this trend may be in jeopardy of failing and essentially retracing the March move.
Lets take a look at how the near term trade may set up keeping in mind that the uptrends from here on out may be corrections of a move lower not higher. Time will tell of course.
A shorter term chart of AKS looks like it is in the process of completing a wave 4 to the down side, possibly turning lower in price to complete the most recent down turn in wave 5. The duration of the 30 minute trading time frame chart to the downside is showing a ten day trend lower. 140 price bars, which fits into a full five wave range of 120-150 complete price bars.
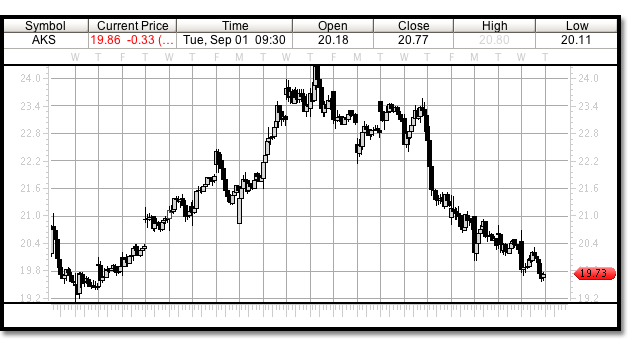
The trading low today, September 30, 2009, of 19.58 could have been test enough of the previous low of 19.15 although MACD levels still do not show a significant retest of this trading low. Other previous trading low turning points to watch are 17.97, 18.64 and the near term 19.15 level.
Using the 19.15 level as a sell stop level AKS could jump briefly to the 21.00 and 22.00 level, its 200 day moving averages for the 15 and 30 minute time frames. The five minute trading time frame MACD is ticking close to crossing the zero line and has created some divergence to price, this could trigger the move. However, it is still too early to calculate a magnitude for a possible wave 1 reversal.
We can enter this trade with little confidence, given that fact the sell stop level may be easily triggered before a wave 5 has formed, and that a simple trend line on the daily chart has been broken. If we have found the characteristics of a top in AKS then we can possibly avoid failed trades in the past.
Today, October 13, 2009, as an update to our calls on AKS, we can see that the short term bounce off the September 30, 2009 low did not solidify. However, we can see that our call for a test of the 17.97 trading level in AKS was a good price level to watch for. Looking at the trading chart below we can see that AKS made a price level low of 19.57 on October 2, 2009 and closed at 18.05 that same day just a few cents over our prediction of a turning point price.
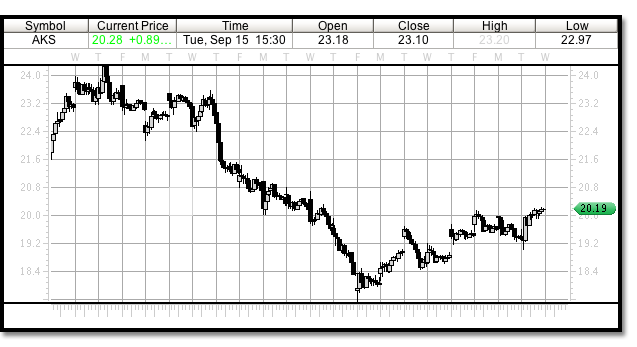
The current trading level is close to its top according to the latest 30 minute trading time frame Elliott Wave move. Trading off its low of 17.57 to a wave 1 top of 18.51 our wave 3 trading level would have been 19.67 right where the stock has rested lately. A wave 5 target would be 20.96 quite close to the trading action we saw today. Looking at the daily chart again, this latest move could be topping out a B wave corrective wave move, with a larger move lower possible unless the uptrend continues on a larger trading time frame. Trade within your trading time frame appropriately.