If you don’t know about LEAP, you’re probably better off as a trader. Unless you have been short. However, there are some interesting things to consider while looking at the chart and realizing some of the recent market news.
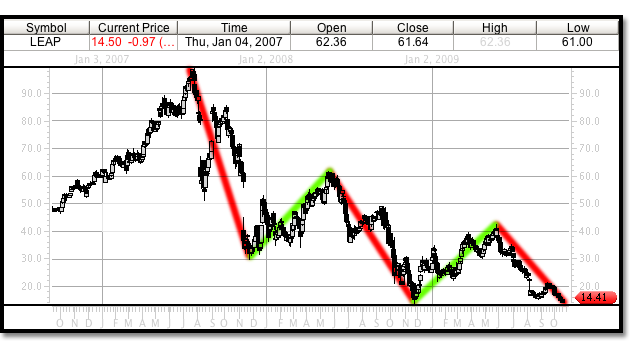
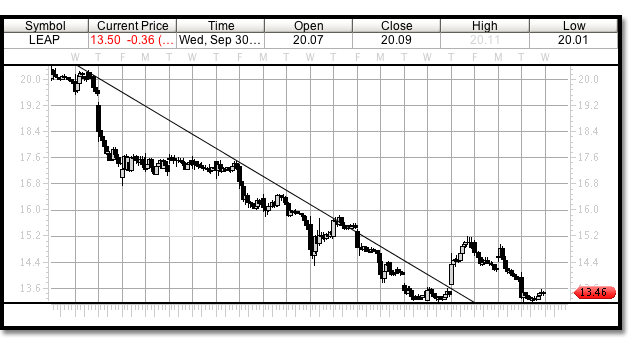
The most compelling factor to consider at this moment with LEAP is it’s trading duration period. Take a look at this chart below.
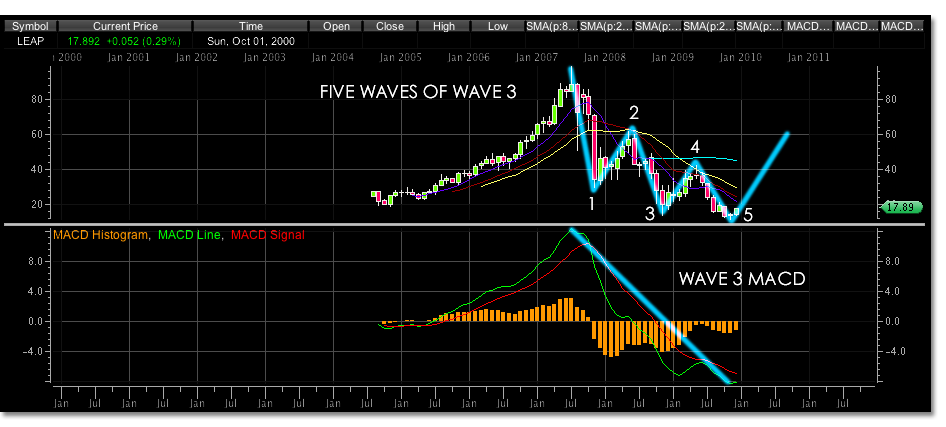
The duration period in this chart is quite close and approaching a possible trading duration range turning point. Outlining the trading highs and lows from left to right:
-
7/25/07 – 99.04
11/23/07 – 31.50
5/16/08 – 61.67
11/21/08 – 14.18
5/27/09 – 42.47
4, 6, 6, and so far 5 months between these historical trading turning points. The average not including the current duration period is 5.33 months. LEAP is trading a week away from this duration currently and appears to be forming its final wave 5 corrective wave. Its most recent trading action has set up a particularly interesting test of a wave 1 trading level of 14.18 on a monthly chart and 14.31 on a daily.
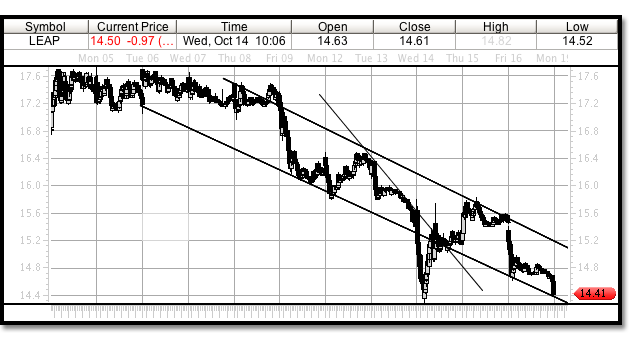
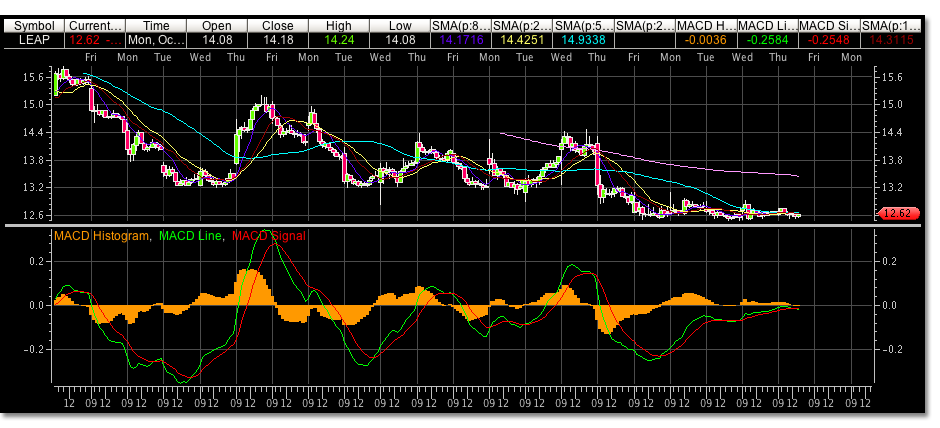
The chart below shows the most recent trading channel and the valid trend line that has been broken to enter the trade. If optimism were to finally prevail for LEAP it would hold this most recent trading low of 14.41 and trade higher for a 5 month duration. The chance that the monthly low of 14.18 will be taken out is quite strong however and this trade could still be very risky. The MACD is showing a nice divergence and has tested the 14.31 level on a 1 minute trading time frame, but the 15 minute is showing room to the downside if a quick correction is not realized.
LEAP has also been mentioned as a possible takeover target in this review. Reuters reiterated an outperform on the stock October 15, 2009. Standard and Poor’s gives it a 4 star rating as of 10/10/09. Market Edge rates it neutral as of 10/10/09. The Jaywalk consensus is hold.
The short term trade analysis for LEAP is being tracked in its trading alerts page.
Today, October 19, 2009 trading looked weak, and our technical resistance points were broken. Our sell stop was triggered.
Some factors to keep an eye on however. October/November has marked two of the last major lows almost to the day (11/23/07 -11/21/08). Both dates traded higher off misses in earnings. Add in the earnings dates and results, after 9 earnings dates from Q2 07 to present there were 7 misses, 1 beat, and 1 meet.
-
8/07/07 beat lower.
12/13/07 miss higher
2/28/08 miss higher
5/9/08 miss lower
8/5/08 miss lower
11/5/08 miss higher
2/26/09 met higher
5/7/09 miss higher
8/6/09 miss lower
4 of those misses lead to higher trading. 3 misses lead to lower trading. The beat lead to lower trading. The meet lead to higher trading.
5 out of 9 earnings periods lead to higher prices regardless of the downtrend, earnings fundamentals or sentiment. 55.55% chance no matter what happens this earnings period, the price may rise. Add that to the duration periods and reverse sentiment, worth monitoring.
Today, October 21, 2009 there was more to note in LEAP. Perhaps not the end of the decline, but possibly a move higher to the larger moving averages above.
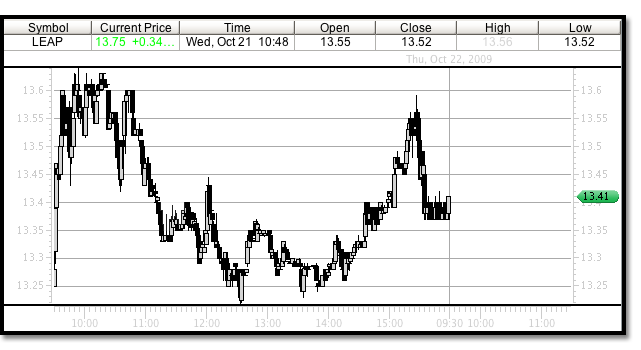
LEAP opened lower than its previous day’s close, broke support from the following day which was 13.25 hitting 13.22, and closed at its previous days closing price 13.41. A typical of a reversal day but would have been nice to close higher. A few last minute bids for 13.43 came through, but they did not hold for the close. In after hours trading LEAP has traded, so far, to 13.79.
This after hours level completes a trading 5 wave profit level from the low. More important than this is the small strength that LEAP exhibited into the markets decline at 3:15 and held these levels.
Yesterday, Thursday October 22, 2009 LEAP broke out of the downtrend and traded to the upside for almost 12.5%. We forecast that this might be a possibility with the reversal day we saw on Wednesday, however this large of a move could not have been anticipated. There is a 14% short interest on the stock, this may have had something to do with the large move, as well as the contrarian report that LEAP would not be pressured as heavily by T Mobiles new price structure to launch soon as this article explains.
Also contrary to recent trading is the underperformance of the telecom sector itself. This was posted Wednesday prior to open on OptionMonster
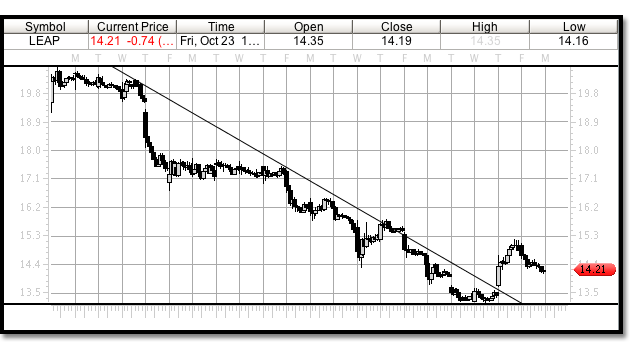
Friday October 23, 2009 trading corrected this gap up and we are seeing pretty responsible retracement from the trading high of 15.22. The 13.22 bottom to this 15.22 level sets up a 14.23 fifty percent Fibonacci retracement level and a 13.97 62% retracement. We traded to a 14.11 low today. This is a price level to consider as possible support. From the 15.22 high to the 14.72 reversal point to the current downtrend, 14.10 and 13.41 are wave 3 and wave 5 price targets to the downside. Watch these trading levels, if the upside trading is to continue these may be good entry points.
Yesterday, Monday October 25, 2009 LEAP traded to its 62% retracement level. In after hours trading Monday a trade was executed for 13.55, a 2.25% drop, perhaps forewarning of the day to follow. Today, Tuesday October 26, 2009 LEAP during overall market weakness traded past the wave 5 corrective price level to our wave 1 low turning point of 13.22. So far LEAP has held this level as it closed today at 13.46.
The trading was organized and reminiscent of the two days prior the last rally, October 20 and 21. Those who are bullish on LEAP would like to see this 13.22 level hold as it would create a important double bottom. So far, this is what the LEAP chart is showing below. There is a bit of speculation that LEAP is due for a bounce. The short interest has risen to 18.94 and a recent article describes interest in the stock being undervalued.
An update today, 11/12/09. I think we might be waiting for a big volume day sometime into options expiration next week. Which also is the same week of November that this stock has made big turns in the past.
The 30 minute MACD flirted with going positive today at 11:00 a.m. which normally has given the stock a two day rally. However, the previous 30min. wave 3 wave 5 MACD divergence did not produce a lasting turning point in which a low held.
The 30 min chart right now, unless MACD does go positive, appears to be headed for possible double divergence. In that the 30min wave 3 wave 5 divergence repeats at higher MACD levels with lower lows in price as the fifth wave of the cycle completes. As of now this has not occurred yet and a lower low could still be ahead before a meanginfull turn.
I think being patient with this one will lead to a more than obvious turning point, and in simplest terms LEAP is just not ready to go up yet.
As I write this LEAP is making new 52 weak lows 11/12/09 13:36.
An update to this duration period analysis is over due. Today is December 22, 2009.
The exactness of the trading in this stock during our anticipated turning point was exciting. In the Watch List it was updated briefly as it occurred, but it is important to add here with the larger analysis. Here is an excerpt from the Watch List post.
Since this post, we might want to rephrase part of this commentary on LEAP- it may be three years in a row that LEAP has made a short term bottom on this day, but this years low may be a long term bottom.
LEAP has traded up 50% since its low on November 16, 2009 when it traded to a low of 11.98. On the 20th it had a large volume day which we were looking for, and it hasn’t looked back since. There appears to be much more room on the topside for LEAP. It has not even completed its wave 3 move yet, which should reach 21.25. This might be attained before the end of the year.
If you go back to the monthly duration period analysis, after this profit level is reached, you can notice that although LEAP usually runs higher until mid May, it troughs in February. This would allow for a correction of the wave 3 we’re watching now before a move higher to 27.00 target wave 5 and a good reentry point after taking profits. We’ll wait and see how this unfolds but this seems to be a good map for what is ahead for traders in LEAP.
It is still important to not forget that the monthly chart MACD wave 3 has not even completed yet. Although LEAP has only been trading a short time respectively, this signal should not be ignored for it still represents the possibility that a lower low could be made on a long term basis as a wave 5 forms.
That said, with this new 52 week low made on Nov. 16, 2009. It does become clear that a 5 wave correction could be completed in the wave 3 monthly downtrend, which leaves a large wave 4 correction to the upside still to come and could last a couple years.

