With weakness in the banking sector as of late, it’s been a good idea to look at banking stocks for any trading opportunities. For long term traders, now does not appear to be the time to step in. Looking at JEF, a short term trade may be presenting itself soon. Other banks may be forming similar charting patterns to recognize and trade.
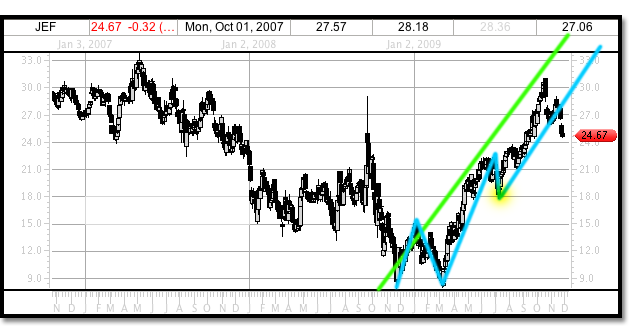
Like most stocks JEF has made a large move off the March 2009 lows. In particular it has made a very large double bottom trading to 7.97, rising to 15.28, then testing this wave 1 almost to 100% retracement at 8.04.
This would make our wave 3 24.31 and our wave 5 target 34.41. The chart for JEF shows that wave 3 underperformed by a few dollars trading to 22.63 and correcting to 17.82 completing a 38% Fibonacci retracement and wave 4. Wave 5 has so far traded to 30.99 and this is where the real analyzing begins.
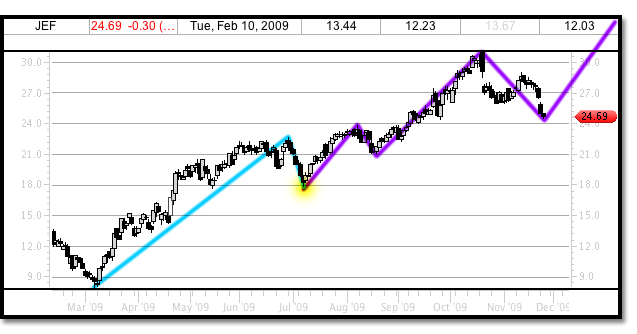
Looking at the chart below realize that the move off the March lows in its completion will be a parent wave 1, which is shown by the green trend line that has not yet found an end point. Also be aware, as stated earlier, that the current analysis of this stock is that wave 3 has underperformed and in turn wave 5 will out perform. The internal waves of parent wave 1 are so far delineated by the blue trend lines. The yellow highlighted turning point is the internal wave 4 of parent wave 1, where our final 5 waves of wave 5 begin.
We know that the 5 wave Elliott wave sequence of parent wave 1 is nearing an end. We can see in the chart that the final five waves of wave 5 of parent wave 1 may not be complete yet however. There is perhaps a chance that this last wave 5 could rebound to the 34-39 price level.
The scenario for this is one we are close to observing now. Right now JEF is close to a 38% retracement from the entire parent wave 1 move off the March lows which would be 22.26. However, we need to look into the final 5 waves of the parent wave 1 at this point to see what the current scenario may be for short term trading given the fact that wave 3 has underperformed and wave 3 of wave 5 internal has outperformed.
Wave 5 of parent wave 1 begins at the wave 4 low of 17.82, the yellow highlight in the charts. Its internal wave 1 trades to 23.77 then corrects 38% to 21.08. The internal wave 3 of this price action would lead to a target price level of 31.12, which we see in the 30.99 price top in JEF so far. This is shown by the purple trend lines in the chart below.
Now, since the wave 2 of this last wave corrected 38% we should expect wave 4 to correct 53% or 62%. This would be 24.09 and 22.82. After this occurs, JEF should make its final push higher to the upper 30 dollar range and attempt 39.34 as a final parent wave 1 price target.
If after the parent wave 1 has completed and reached our target price, JEF will be in a correction wave 2 of parent wave 1. This will lead to either a 38% flat correction around 27.35 or a combination of zig zag or irregular corrections which leads to a 62% correction near 19.89.
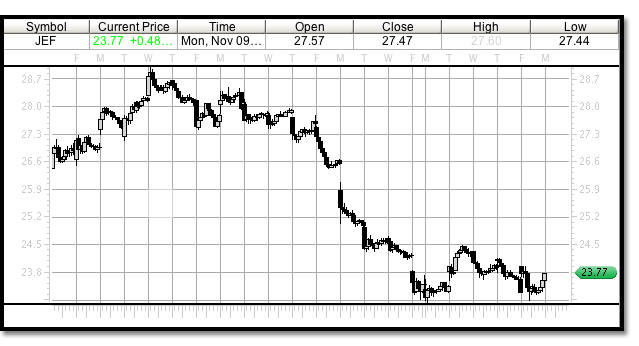
Today, December 4, 2009, we saw JEF test its recent trading lows of 23.05. This didn’t quite reach or anticipated Fibonacci retracement level of 22.82, however it is as of today a successful retest and sets up the possibility that a wave 1 has formed for a meaningful move higher.
The chart below shows the retest as JEF traded to a low of 23.09 and closed at 23.77 on larger than normal volume. The short term trader may get stopped out but discipline must be used regardless of it a sharp push towards the 62% level presents itself in future trading before the anticipated move higher.
The trade is set up in the trading alerts for a 30 minute chart 5 wave series, which brings JEF up towards it’s old highs before pulling back. Larger time frames, as explained earlier in the post may exceed this. Trade according to your time frame.


