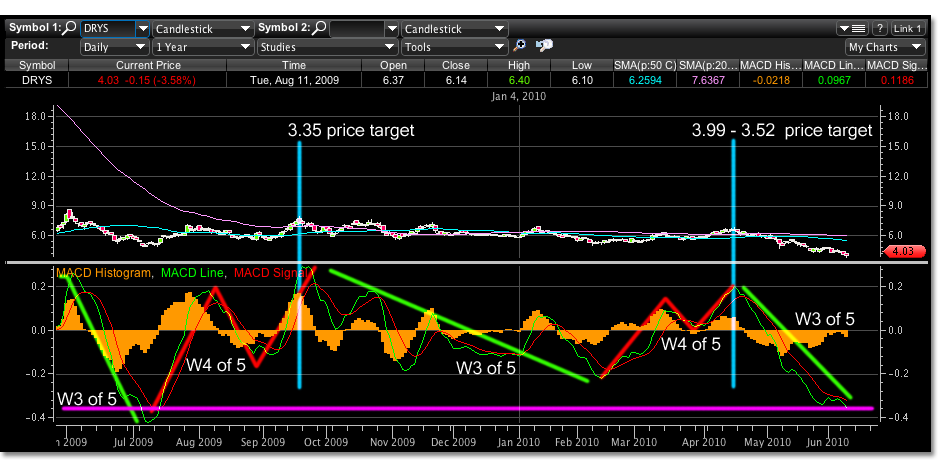
After our sell stop signal on DRYS it became overly clear that the market and stock sentiment was not going to allow for the correction expected and the short term uptrend price targets set. There is a way to calculate the level of correction we have sustained in DryShips up to this point today around the 4.00 range, and this level was indicated in the sell stop trading signal title notes on DryShips as possible. Looking closer at the chart below could provide some insight to what has been happening technically in the DryShips chart.
Elliott Waves price targets can only be projected in 5 wave sequences. In a corrective wave the five wave sequence is found in the wave 5 of the final wave of its relative time frame. So in order to calculate this projection you must wait for wave four to complete itself in each successively lower time frame before reaching the end of the trend.
In the trading chart below we can see some of the wave counts within the macd indicators. They may not be accurate to all the wave price targets at this resolution, but they can be referred to as such to understand that in a parent correction wave the 5 wave sequences are to the downside and the 3 wave sequences are to the upside. Meaning the momentum of the trend is lower. The opposite is used to calculate uptrends.
Starting on the left we see a large macd dip that can be used to signify a wave 3. If so, the trading following this to the upside, a slight correction in price to 7.99, would represent a wave 4. You can see this referenced by the red line drawn in each of the wave 4 patterns. It is drawn as a three wave sequence at this resolution. Seeing this resolution can be rare using the daily time frame to view macd unless the stock is very volatile.
The initial wave 4 to the left is associated only with the previous wave 3. The subsequent labeled waves are like indicators but of a lesser time frames. Again, because of the the volatility of the chart this can be made example of at one resolution of the stocks charts price motion. After the initial wave 4 target is completed a lower time frame should be used to project the 5 wave price target. Likely the 60 minute trading time frame should show divergence to a similar price target.
Also shown with the green line mark up is the wave 5. Green represents the power move is to the downside. The green mark up is labeled wave 3 of wave 5 because each macd reading for a wave 5 is actually a wave 3 of wave 5 of a greater resolution (time frame) we then wait till the next wave 4 develops and project again a wave 5 price target using a smaller time frame until the target is met as previously mentioned.
Using Elliott Wave calculations, a wave 5 price target using the 7.99 price high point could be 3.35. Projecting from the next wave 4 top of 6.82 a initial price target of 3.99 is made- which we have met today. The lower end of the target range based on the 6.82 top would be 3.52. It is sometimes hard to develop a price target projection if the internal wave 1 of wave 5 macd technical indicators are not available. Many charting software programs are limited in the price history that they can provide, but estimates can be made after wave 4 has been completed.
Also we can see that there is a divergence between the wave 3 and wave 5 of the largest time frame shown in this chart by looking at the pink horizontal line. This divergence would most likely need to be maintained in order for the 3.35 price range to be upheld. If not, than a larger time frames wave 4 projection was not taken into account. The 2.72 to 11.48 price range would then be in itself a wave 4 to correct to a lower wave 5, or the previous wave 4 top at the 17.35 price level was not completed yet. This might lead to a price around 2.15.
However, there is still indication that if the 2.72 low is held DRYS could be in for a move to 16.89 – 22.30 depending on which wave count develops. The larger price target means that the current trading is developing a wave 2 and DRYS can correct up to 100% of its move from 2.72. The lower price target could mean that DRYS is in a long wave 4 correcting from the 11.48 high and DryShips current price range between 4.00 – 3.35 is creating a bottom.

