WATG hit a long term profit level set in May 2010 yesterday, trading to 11.37.
WATG Q3 earnings are expected to be 0.320 | 0.231 | 0.170.
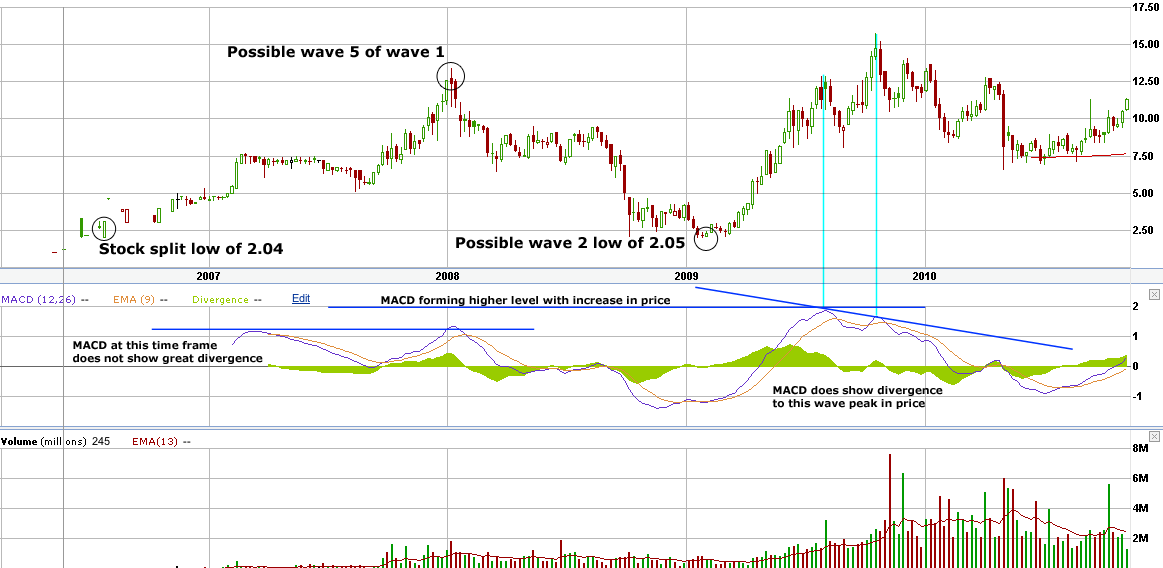
There is one stock split for WATG and it took place on June 24, 2006. The low on this day was 2.04. Fast forward to January 26, 2009 and the stock traded to a low of 2.05. It is hard not to believe that trading between these two lows does not reflect the ultimate wave 1, at least relative to the extremity of the price motion.
The MACD does show a higher peak level at the possible wave 1 peak than the possible wave 3 of wave 1 peak, but it is hard to even measure this at this time frame with the lack of price history and the charting being used.
For now the analysis will be resolved to determining where WATG may be trading today relative to the assumption that from 2.04 to 13.37 WATG completed a wave 1 to some degree. From the 13.37 high, WATG makes a 100% wave 2 correction to 2.05.
Wave 3 forms from this price zero point and continues trading higher than the initial wave 1 price on 10/21/09 when it trades to 15.78. It is important to try and decipher what has happened between these two points on the trading chart before going further.
The fact that WATG is in a parent wave 3 has been established by a successful test of the parent wave 1 price zero point. The price high of wave 1 has been broken further establishing that momentum and trend is to the upside, also verified by the MACD levels at this time frame.
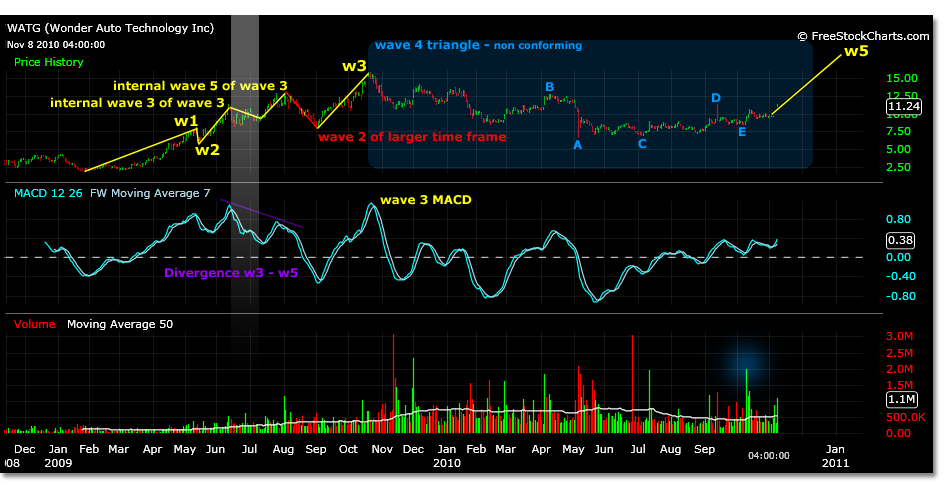
Take a look at an internal wave count of this last move from 2.05 to 15.78 at a daily time frame now. A wave pattern can be made out from 2.05 to 2.98 of an internal time frame. This perhaps gives us the internal structure of the initial internal wave 3 of wave 1. The parent wave 1 top to this internal wave is most likely the 7.90 price high on May 8, 2009 as the projected high was 7.49.
The correction that followed was shallow or flat only reaching to 6.04 instead of a projected 5.66 for a flat scenario. From there prices traded to 11.39 actual. This is the internal wave 3 of wave 3 of this time frame. The projected price target was 10.98.
After this you can see from the price motion alone that there was an internal wave 4 triangle which lead to a wave 5 high of 12.83 of the greater time frame shown by the gray shaded area in the chart. A correction then occurred to just above the parent wave 1 price high of 7.90, reaching 8.10 and maintaining the uptrend.
The wave 5 of wave 3 price target for the trading time frame established from 2.05 to 7.90 comes to 15.13, which brings the trading analysis to the 15.78 price high on 10/21/09 and a parent wave 3 of this time frame represented in the MACD. This is labeled wave 3 in the chart.
Trading in WATG since this high has been a wave 4 triangle. However, it has been an imaginative one. All the price points are there, yet a couple are reversed which would have been confusing to trade. Laying out the price motion for a wave 4 triangle pattern would result in the following numbers.
From a price zero point of 2.05 to 15.78 or actual: A:7.33 B:12.61 C:9.44 D:11.55 E:10.49
From a price zero point of 2.05 to 15.13 or projected: A:7.08 B:12.11 C:9.09 D:11.10 E:10.10
By looking at the chart WATG made this formation with creativity and difficulty, but in the end the confirmation of the E wave price zero point for the ensuing wave 5 higher was fairly accurate and verifiable to a degree due to volume.
Following through the marked up chart, WATG made its corrective wave A decent to a price low of 8.41 on February 12, 2010. This was not the anticipated low for either of the projections. It then traded to 12.77, very close to the B wave actual projection. If a trader saw this projected price occur with knowledge of the triangle formation they may infer that the shallow wave A was complete.
WATG confirmed the wave A low was not completed by then trading to 6.58 on May 6, 2010 in very volatile fashion but very accurately confirming the projections for wave A in price and MACD. MACD wave A in a triangle will always have the greatest momentum. If it hasn’t been unorthodox enough, oddly WATG doesn’t then re confirm the B wave top at the 12.00 range. It has already done this.
Trading continues in the 8.00 – 9.00 range as if it is testing the wave C lows of the triangle then violently trades to 11.30 on September 14, 2010 touching off the D wave price targets accurately.
Finally the E wave. A look at the volume may hint to when this wave 4 triangle completed itself and the wave 1 of wave 5 began. Referencing the price projections it should be either 10.50 or 10.10 or near to these prices, after the 11.30 spike of course.
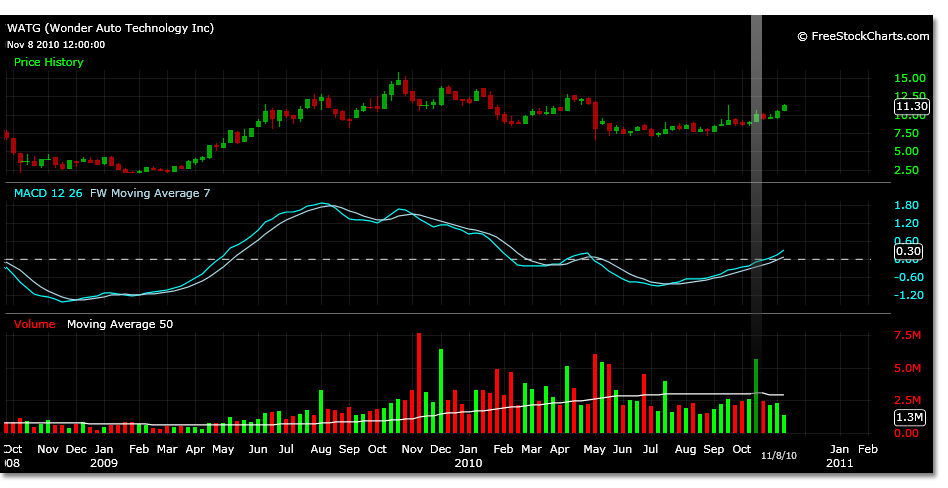
Visually on 10/11/10 on a daily chart, the triangle formation comes to a point on heavy volume but at a lower level than projected. However, if you remember to revert back to a larger time frame, because this is a wave 4 of the larger time frame you see a different picture. Take a look at the weekly chart of WATG during the week of 10/15/10. A low of 9.02 a high of 10.56 and a close of 10.07 on close to 6 million shares which was close to 3 times normal weekly volume. These prices are in line with projections.
At the daily time frame the WATG chart, in this instance, does not provide a good example of a well defined triangle formation. Regardless, if it is confirmed that a wave 4 triangle formation may be completed within the trading time frame being discussed, then prices in WATG should be heading higher.
Specifically, the closest projected price target for wave 1 of wave 5 is 13.72. A correction from this internal wave structure should then occur. 11.48 is an estimated 38% correction.
Wave 3 internal could reach 18.20 – 19.35. Wave 4 would correct according to what happens in wave 2. Wave 2 and 4 often alternate corrective projections.
The wave 5 price target is a range of 23.21 – 27.37 based from projected and actual prices from the initial wave 1 of 2.05 to 7.90.
This peak price would then complete wave 5 of wave 3 of the parent wave from 2.04 to 13.37.
Switching quickly to the weekly time frame, make note that the price of 12.61 could also create resistance as a weekly time frame wave 4 B wave target. This would be relative to the internal wave 3 of wave 1 of wave 5 at the daily time frame.
All these projections are being made from historical price motion data and may need to be updated as the actual wave counts and prices develop to become more accurate.


