
Melco Crown Entertainment has been a great trading stock since the lows in 2009.
In early November 2010 MPEL reached a long term trading target of 7.20 and was in a projected correction until it broke this 7.20 level with a gap open higher on January 11, 2011.
The break of this level to the current highs of 7.88 was unexpected in the prior analysis of the correction, however the recent price motion can currently be analyzed as being part of a larger monthly trend.
Prefacing the following analysis a previously stated observance should be revisited. This being that during the prior move to 7.20 the MACD created a new wave 3 scenario and that this was a signal of the larger trends move, yet was not used as a signal to check the larger trends price projections unfortunately. This MACD level was illustrated in the following chart.
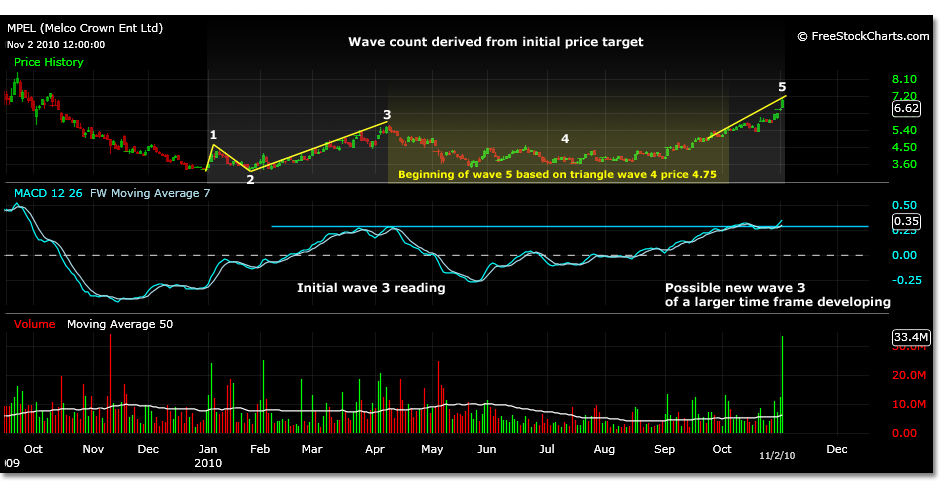
Currently checking the larger time frames trading scenario for relative price targets since the move past 7.20 (7. 20 was an internal wave count price projection) it becomes clearer from a price motion stand point why MPEL broke the expected correction trading range, as well as what the current price high of 7.88 could represent.
Start by looking at a monthly chart of MPEL. It is easy to view the parent wave count. It is also possible that the prior wave 3 at 7.20 may have been an internal wave 3. Its wave 5 being the internal wave 1 of parent wave 3.
The parent wave begins from the March 2009 low of 2.27, to the high of 8.45 in September of that same year. This represents a potential wave 1 and was first diagnosed as such in mid November 2009 just before MPEL made its last major low-a possible parent wave 2 low.
If these prior wave counts are correct, then MPEL has been in a parent wave 3 move since its 3.26 low December 2009. Using the prior parent wave 1 magnitude, MPEL’s internal wave 1 of parent wave 3 price target projected to 7.80. This confirms the analysis that the current trading move in MPEL could be topping out here at internal wave 1 of parent wave 3.
The parent wave count on a monthly chart is shown in yellow and the internal wave count of parent wave 3 is shown in light blue in the monthly chart below.

As previously stated, this price target (7.80) likely relates to the current price in MPEL as well as the relationship realized in the daily MACD forming a new wave 3. This wave 3 MACD on the daily time frame represents the internal parent wave 1 price target on the monthly. At smaller time frames the divergence of these two prices (7.20 – 7.88) will be seen in the MACD, a divergence of wave 3 and 5.
If this is the case, then MPEL should begin a correction from these levels in an internal wave 2 of parent 3. This correction could be severe as wave 2 can correct up to 100%, however the relative Fibonacci retracements should be expected.
More exact price projections to the downside can be made after the current move towards the 7.88 price high on January 18, 2011 is sufficiently tested and not broken to the upside.
A full list of MPEL analysis posts can be found here, or by accessing the MPEL meta tag link.