
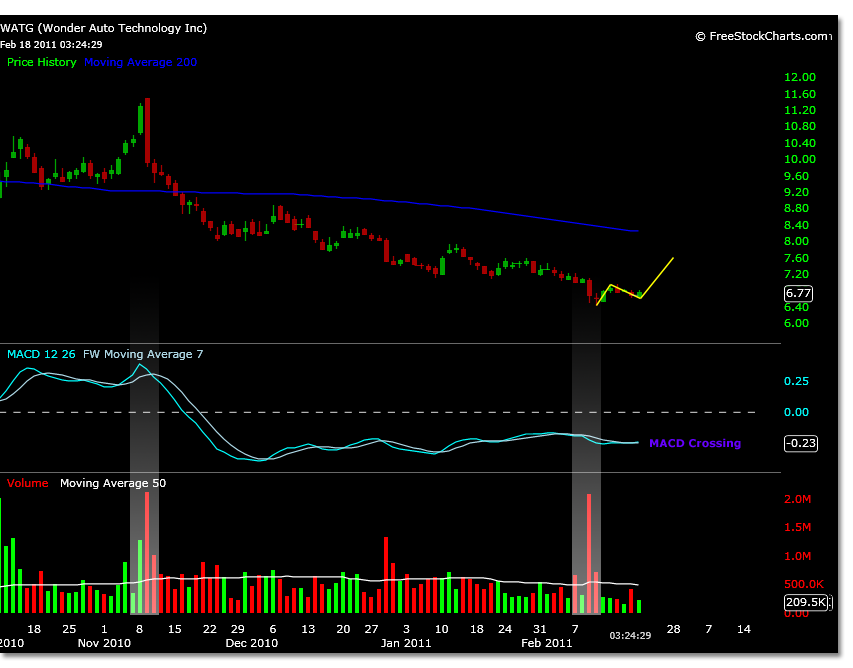
Last week WATG was targeted with an interesting trade setup off a pattern in volume seen in the daily chart.
Today WATG traded solidly into the market selloff, trading up over 2.5% at the open testing a parent wave 1 high price.
Although WATG ended the day lower this same percentage, a look at the 15 minute trading chart shows good correlation to the present correction being part of a possible Elliott Wave sequence.
The internal wave 1 off the 6.41 low is 6.54 actual. This is shown with yellow type in the chart below.
This internal wave magnitude calculates to a wave 5 of 6.88. This price was the initial high on 2/14/11, then the actual high of 6.95 occurred, which has now been tested twice- today at 6.94.
Support in todays trading was seen at 6.56, with large lots at the open that did not fill as the stock ran higher. Then again at this price at the close, though few shares were filled at this price.
This price point specifically is the internal wave 1 of parent wave 1 (6.41 to 6.95) projected. Meaning the actual price motion did not correlate to this internal wave 1 price point yet a projected internal wave structure of the actual parent wave 1 does.
Maintaining an internal wave 1 price level is often seen as important to the continuation of the expected price motion trend.
However, because this is ultimately a parent wave 1 as well, 100% of the move off 6.41 could be corrected. A move below this removes current upside targets.
So far, it is encouraging to see support at a .618 retracement of the prior parent wave 1 move and the possibility of the trade developing further.
If this wave count does develop, parent wave 3 target is 7.61 and parent wave 5 target is 8.36 (near the 200 dma). These price projections are calculated using the actual prices 6.41 to 6.95 as parent wave 1 magnitude.
