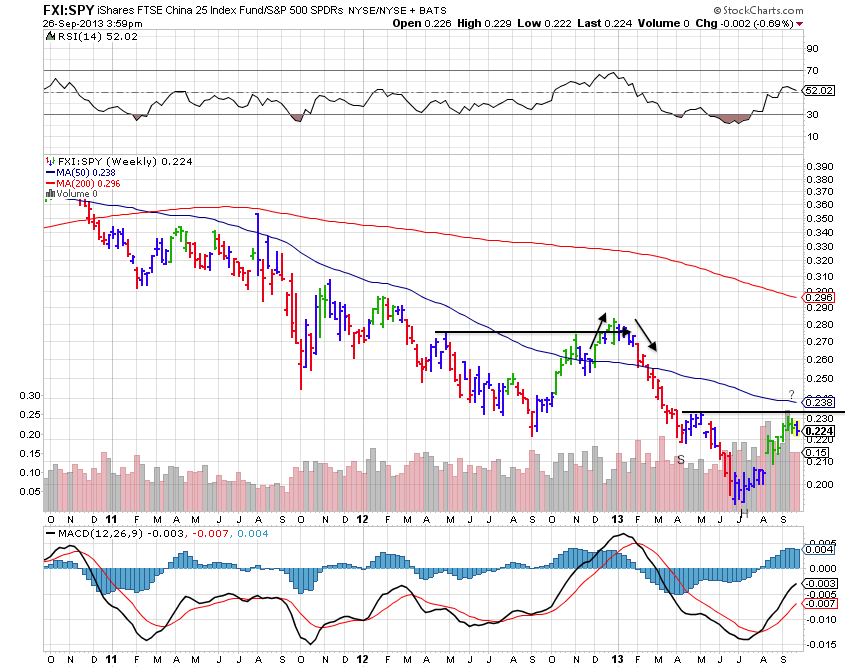
Im not used to viewing ratio charts but I have been following one lately. Basically if FXI SPY continues to reverse I will likely be dead wrong on my long stocks and short China trades if not for other reasons- ie stock picking and already being wrong.
However, weekly trend of ratio looks lower for FXI.
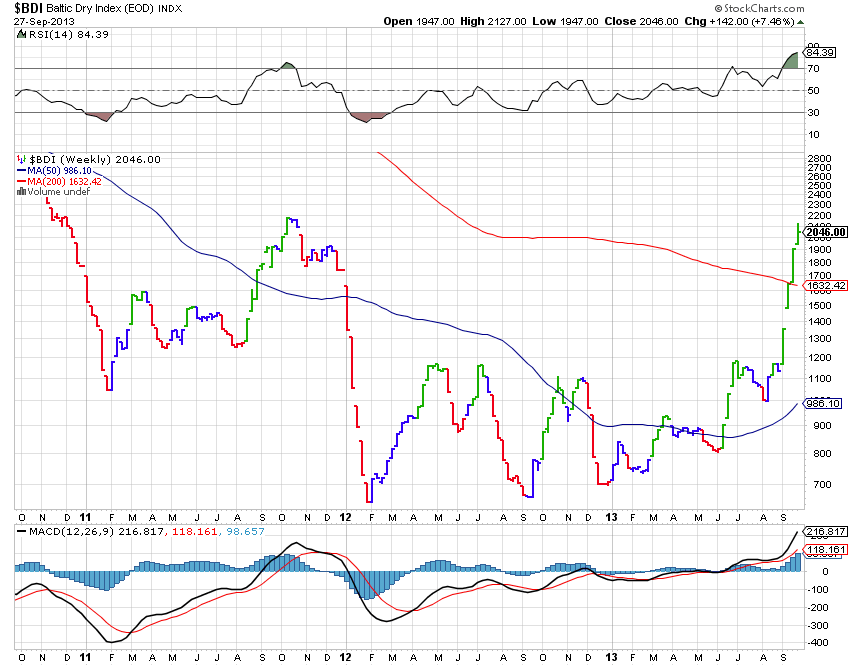
IYT SMH IBB are hovering at highs during the latest FXI SPY counter trend move along with BDI making strong move off all time lows past few months. Is this meaningful or will they breakdown?
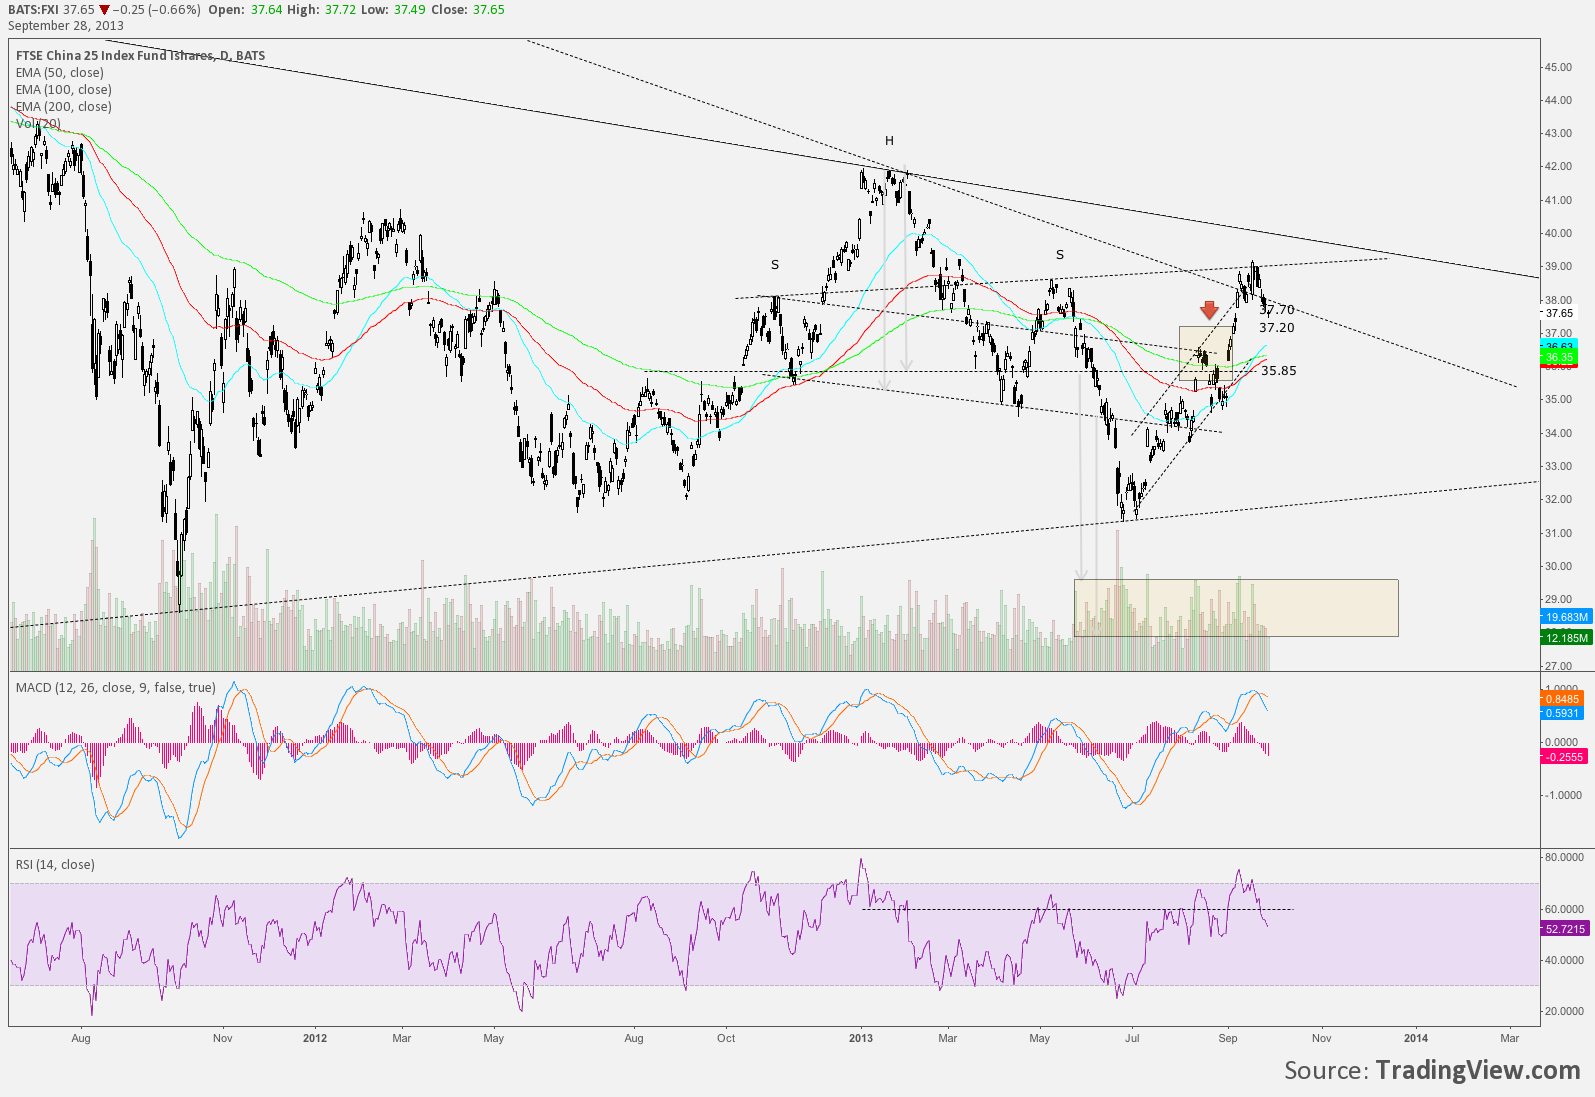
Despite the known bearish China rhetoric scenarios FXI is making higher highs and higher lows currently.
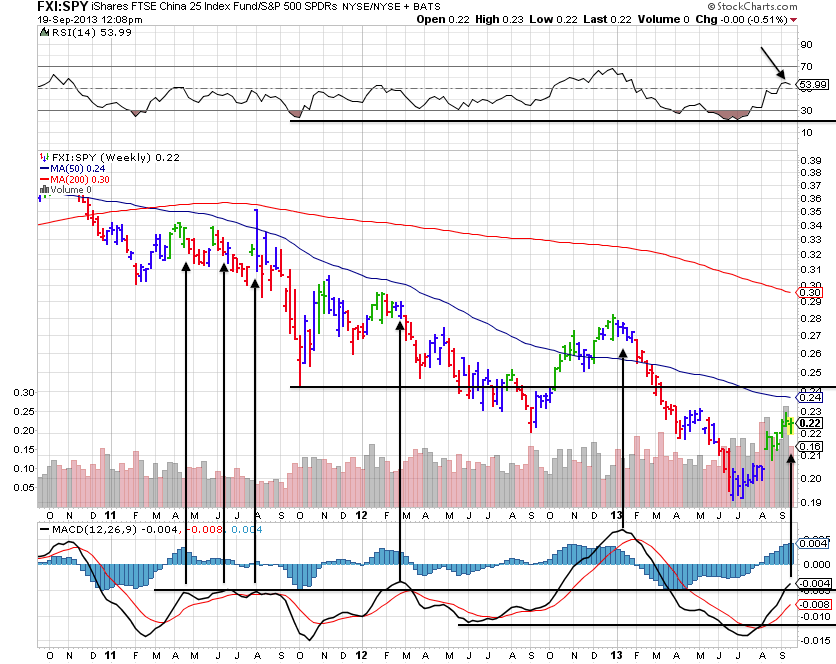
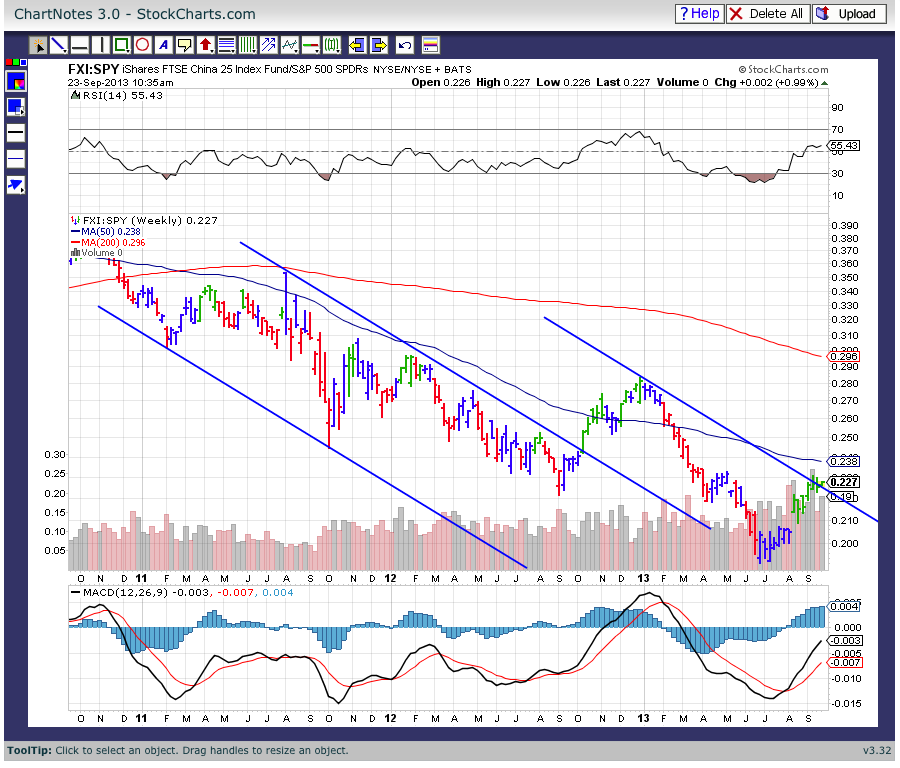
Three screen grabs over the past couple weeks of the FXI SPY ratio chart below.
Making a new low in MACD and RSI at prior lows doesn’t fair well in my opinion that a long term low is in.
The ratio is clinging to TL at a prior resistance level below the 50 SMA.
Will a head and shoulders reversal develop or will continuation lower? It would be a most obvious weekly inverse head and shoulder bottom.
Ive not timed my positions perfectly but we’ll see. Certainly looking at this last chart to me it appears that whats about to happen may be more important than what has transpired off this latest low.

