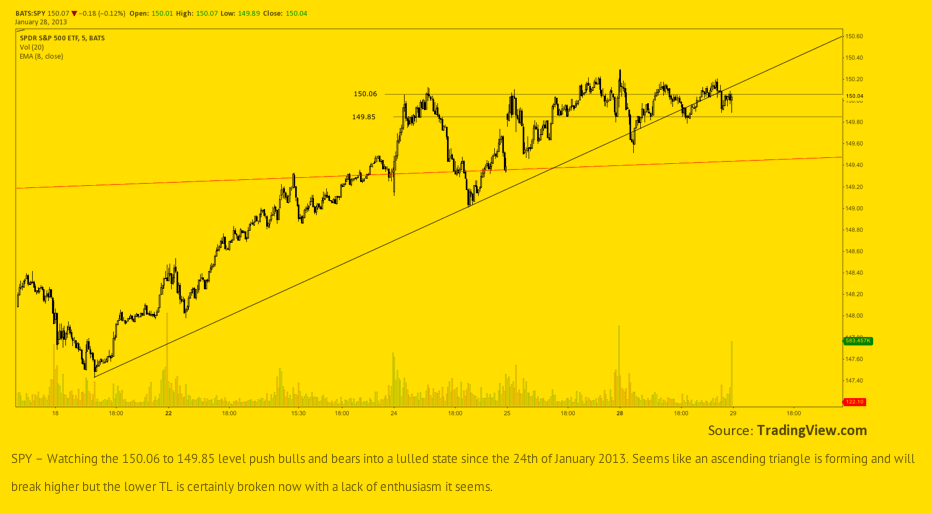
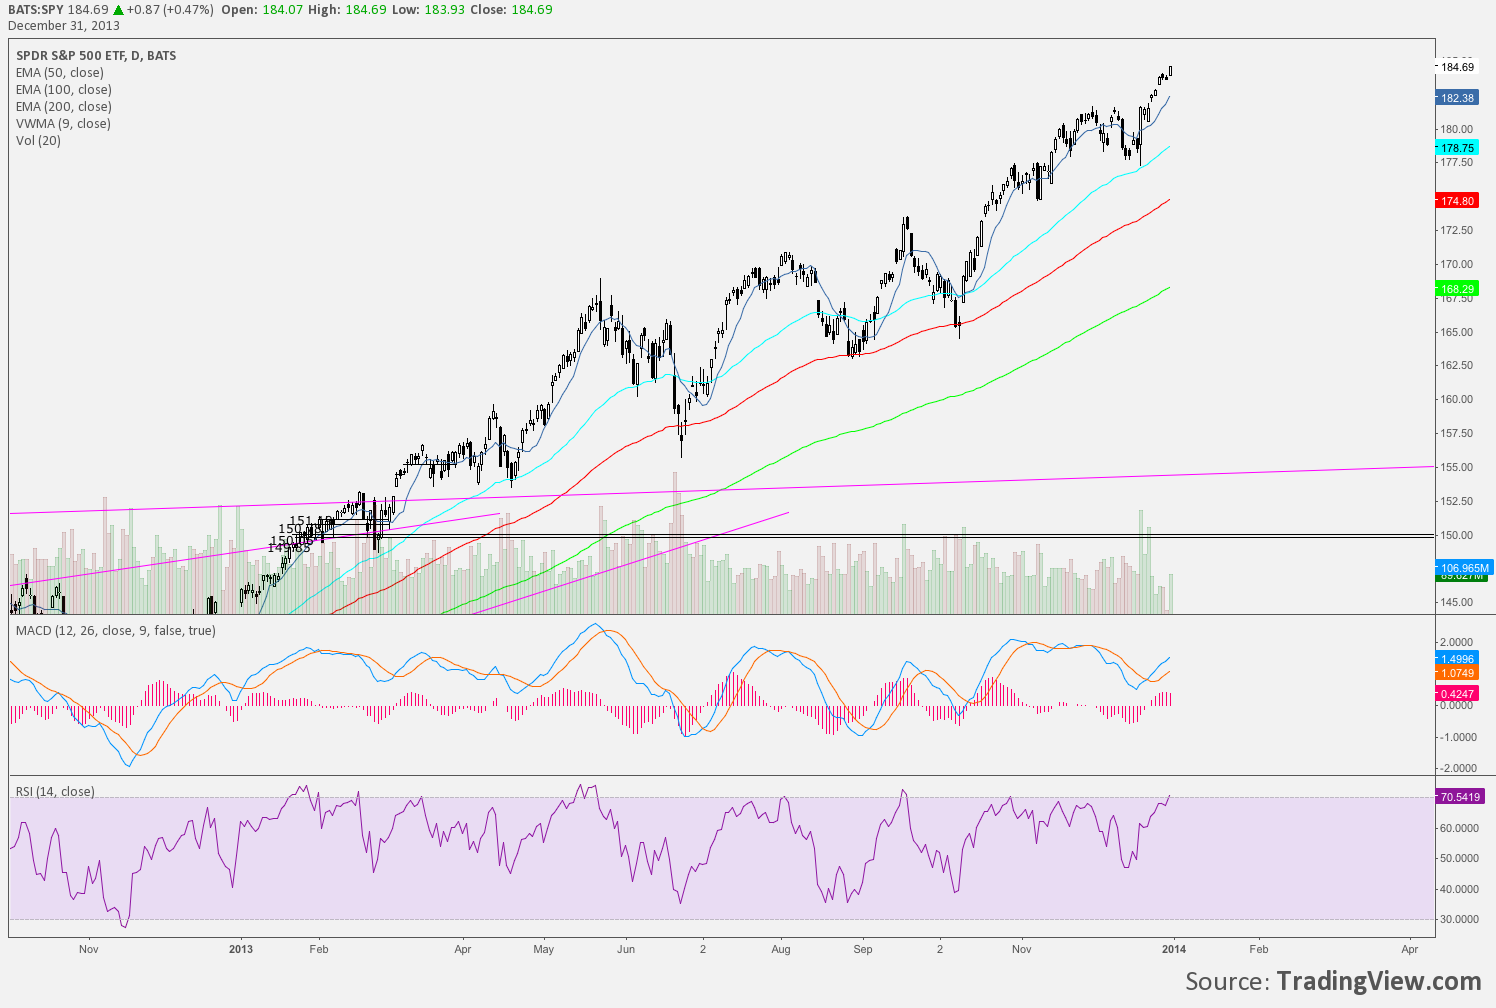
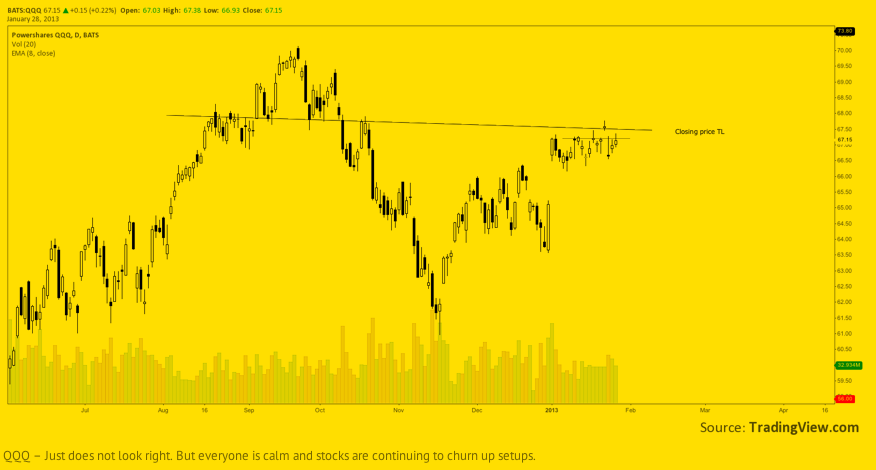
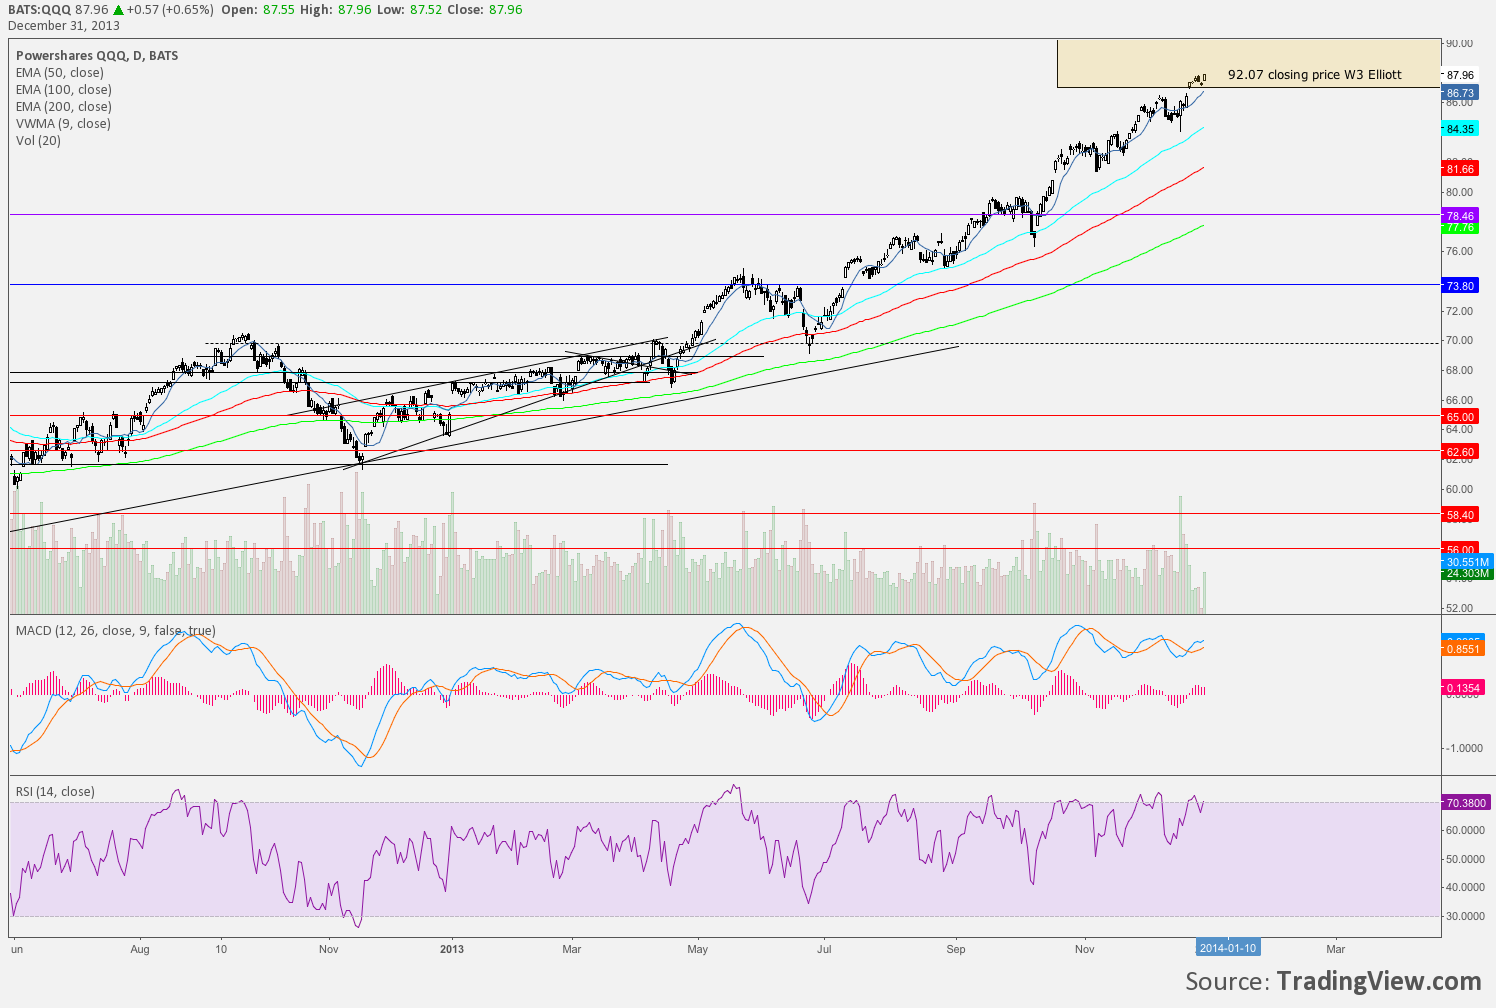
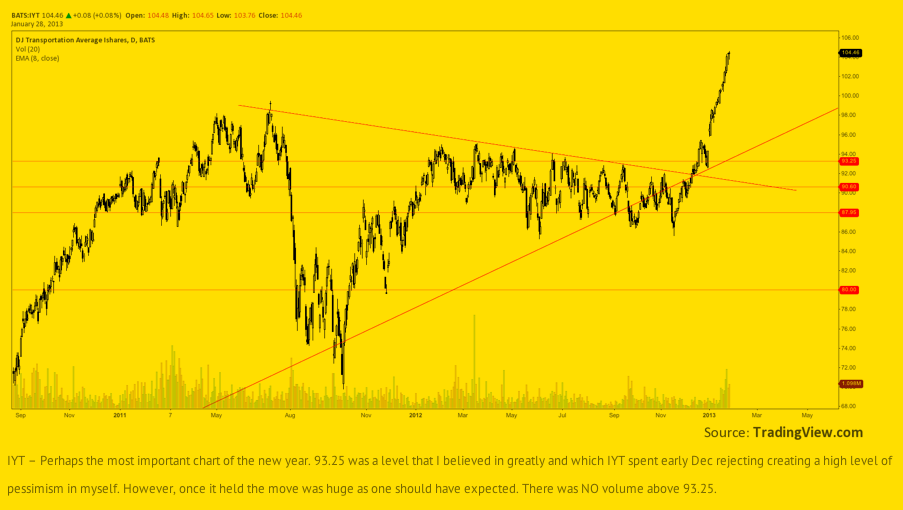
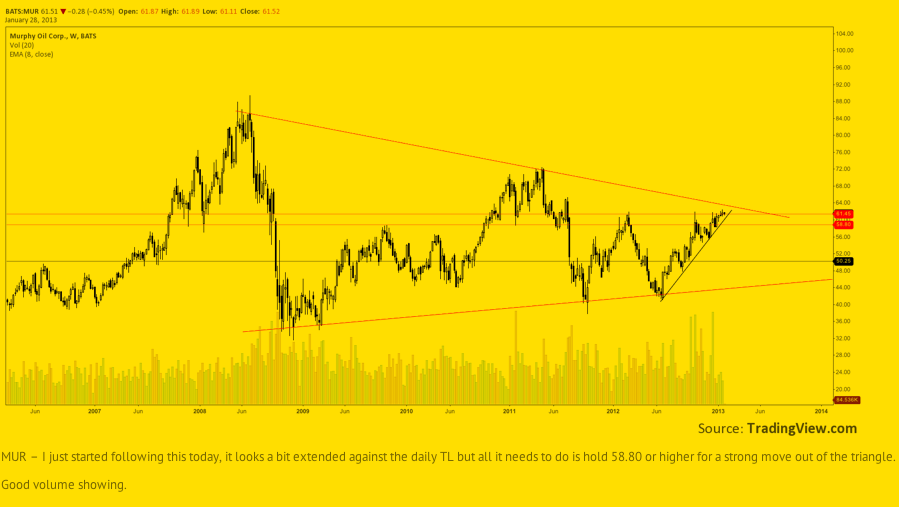
After re-reading last January chart thoughts Id like to post a present day comparison. I wont go through all the charts just particulars. Screen grab of the Jan 2013 chart and comments (tinted yellow) will precede current charts.
SPY – Going to start things off with a big “F” for a grade. Last Jan SPY chart below is a 5 min chart! I can certainly tell that my sentiment and my point of view were at an extreme last January. Very narrow-minded. Luckily I changed that and didn’t look at everything that way. Its a huge value to have this look back available.
QQQ – Pessimism was there. It wasn’t easy in the beginning.
But now at all time highs and approaching highest of our projections in late March – chart.
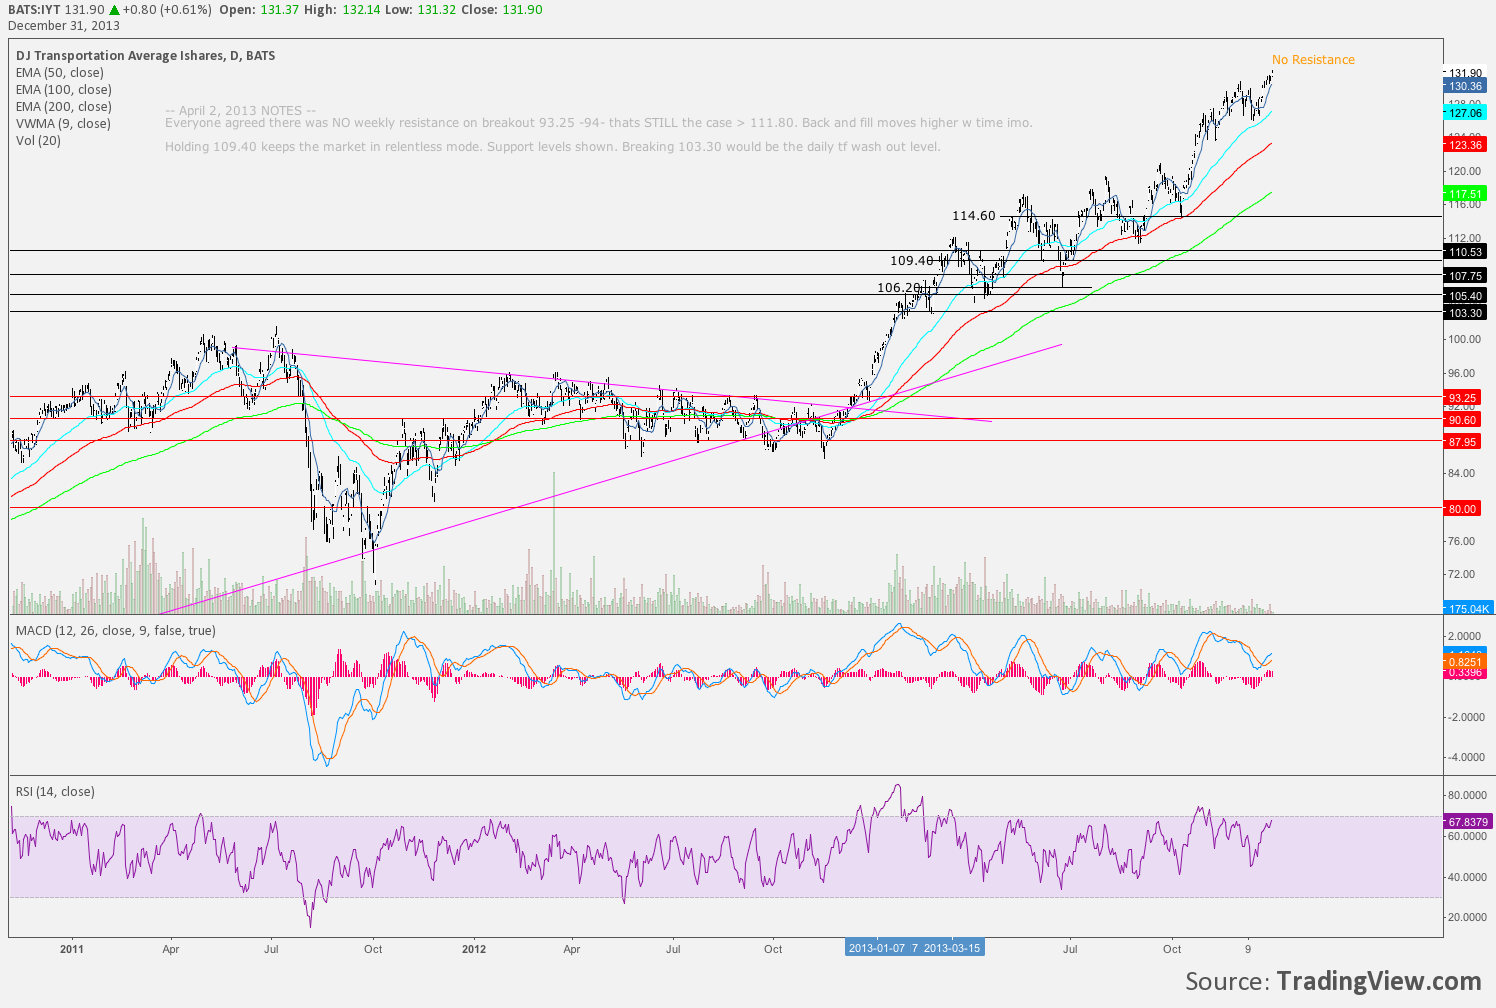
IYT – Still one of the greatest breakouts. Constantly pushing the “no resistance” level higher and higher – initial move April chart on ST. Many at the end of this year are calling for 2014 to be the a good year for shipping. Bottoming pattern in BDI late June – chart.
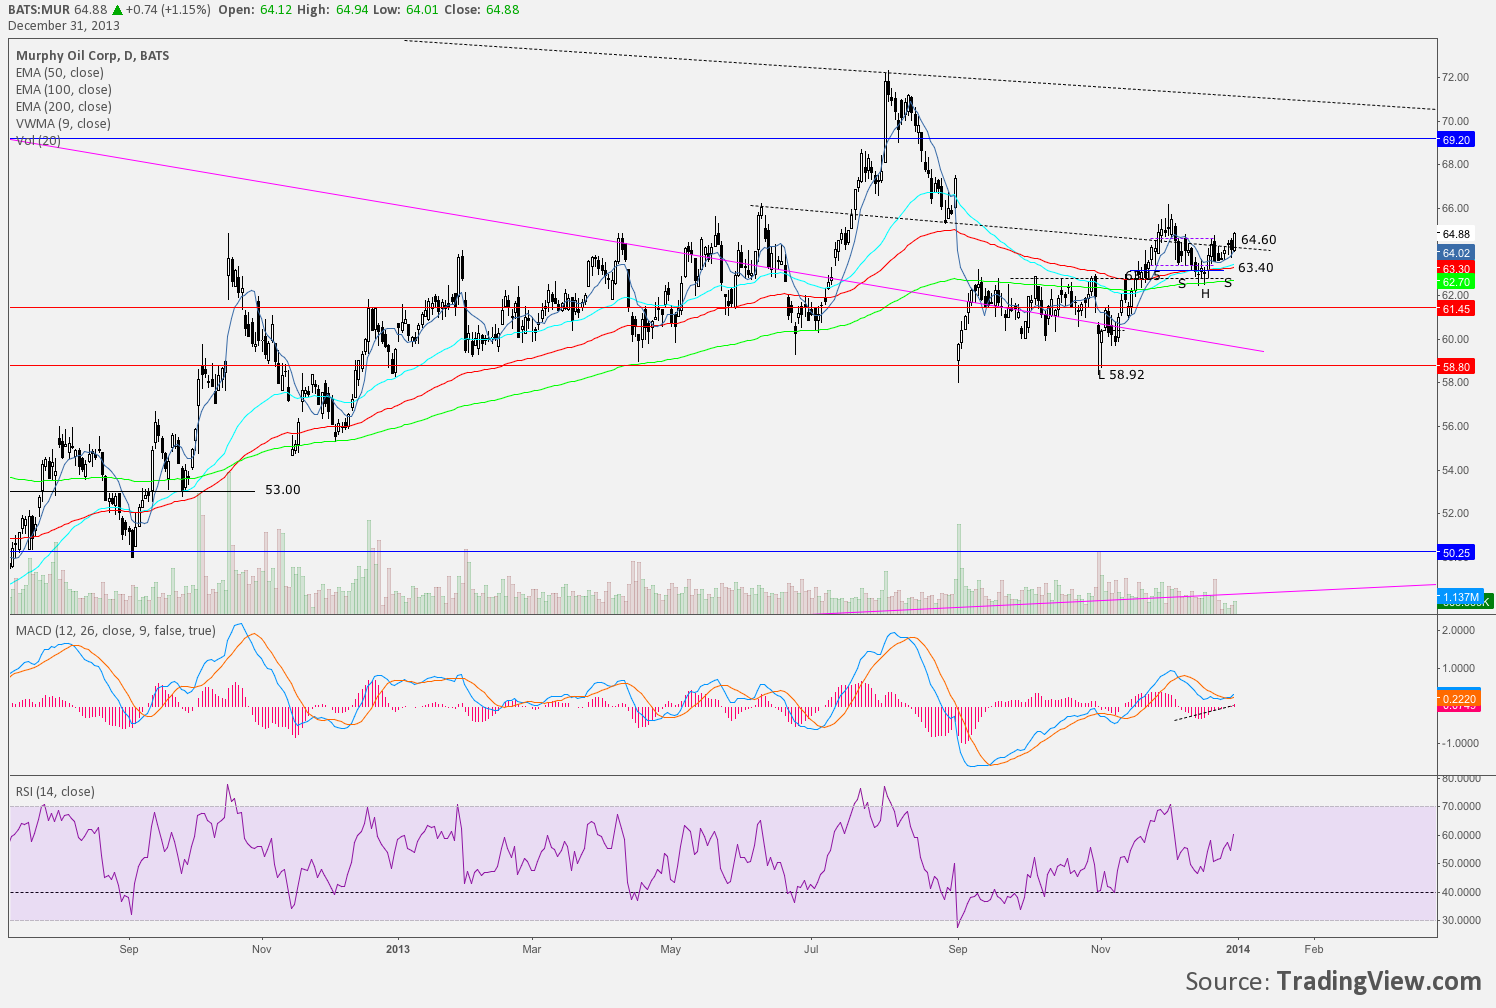
MUR – A lot of following continued as the chart setup and almost ran away. I finally took a shot during a gap/pullback in earnings and still expecting good things though it is hung up in a messy area of SupRes at the moment. Other posts on MUR stock/position are available.
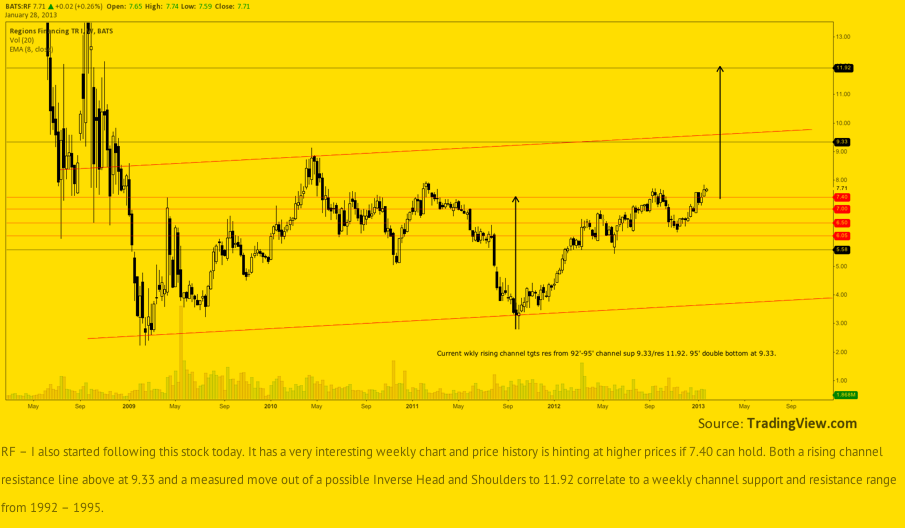
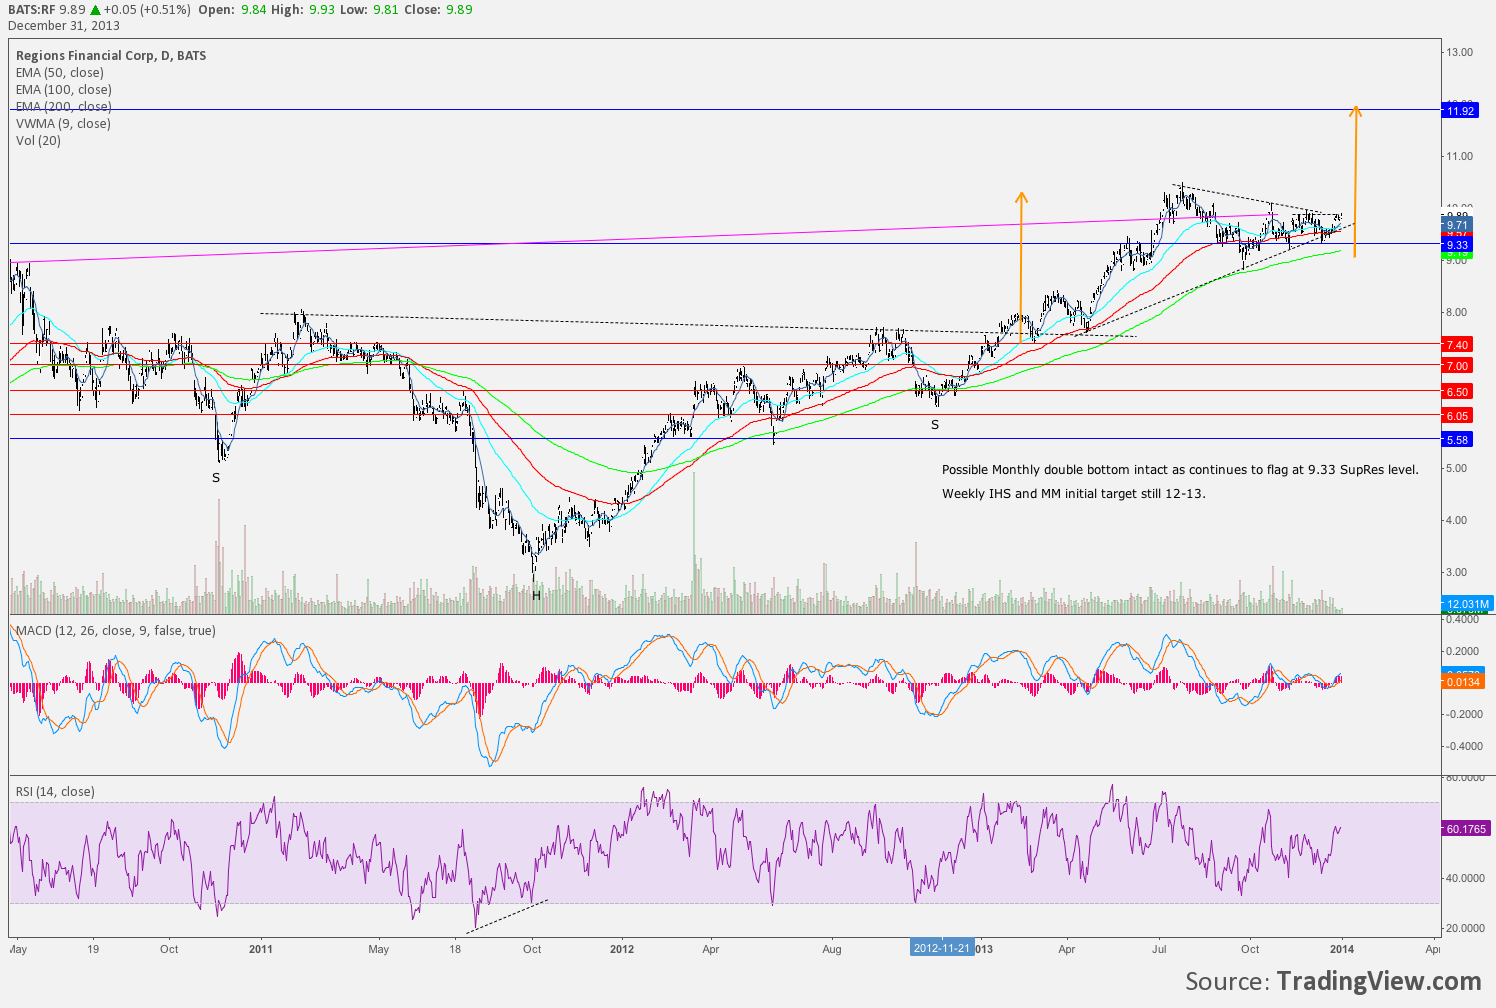
RF – Another one I had followed for a very long time. Recently took an undisclosed position at 9.52 then sold that same days close. Just didn’t like the close, scared out trying to pick a bottom. It has since run nicely and I’ve not yet gotten involved. Posted to the stream a couple times about RF potential to 12.
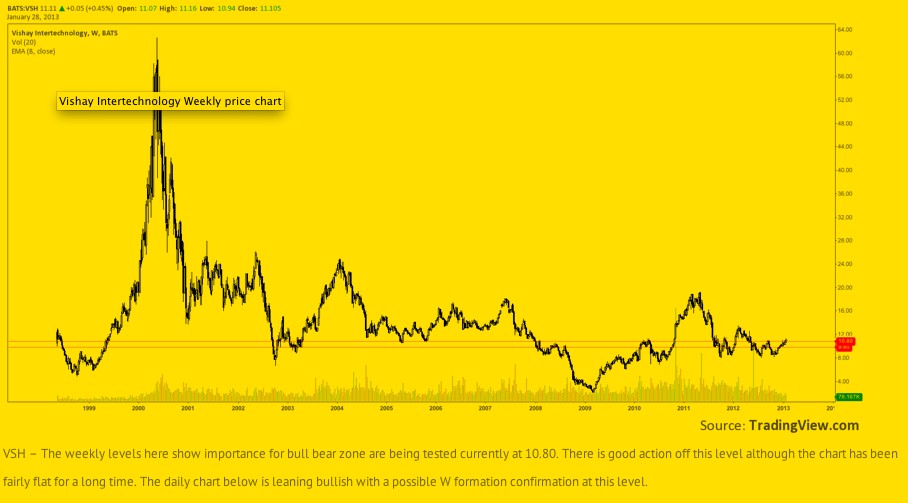
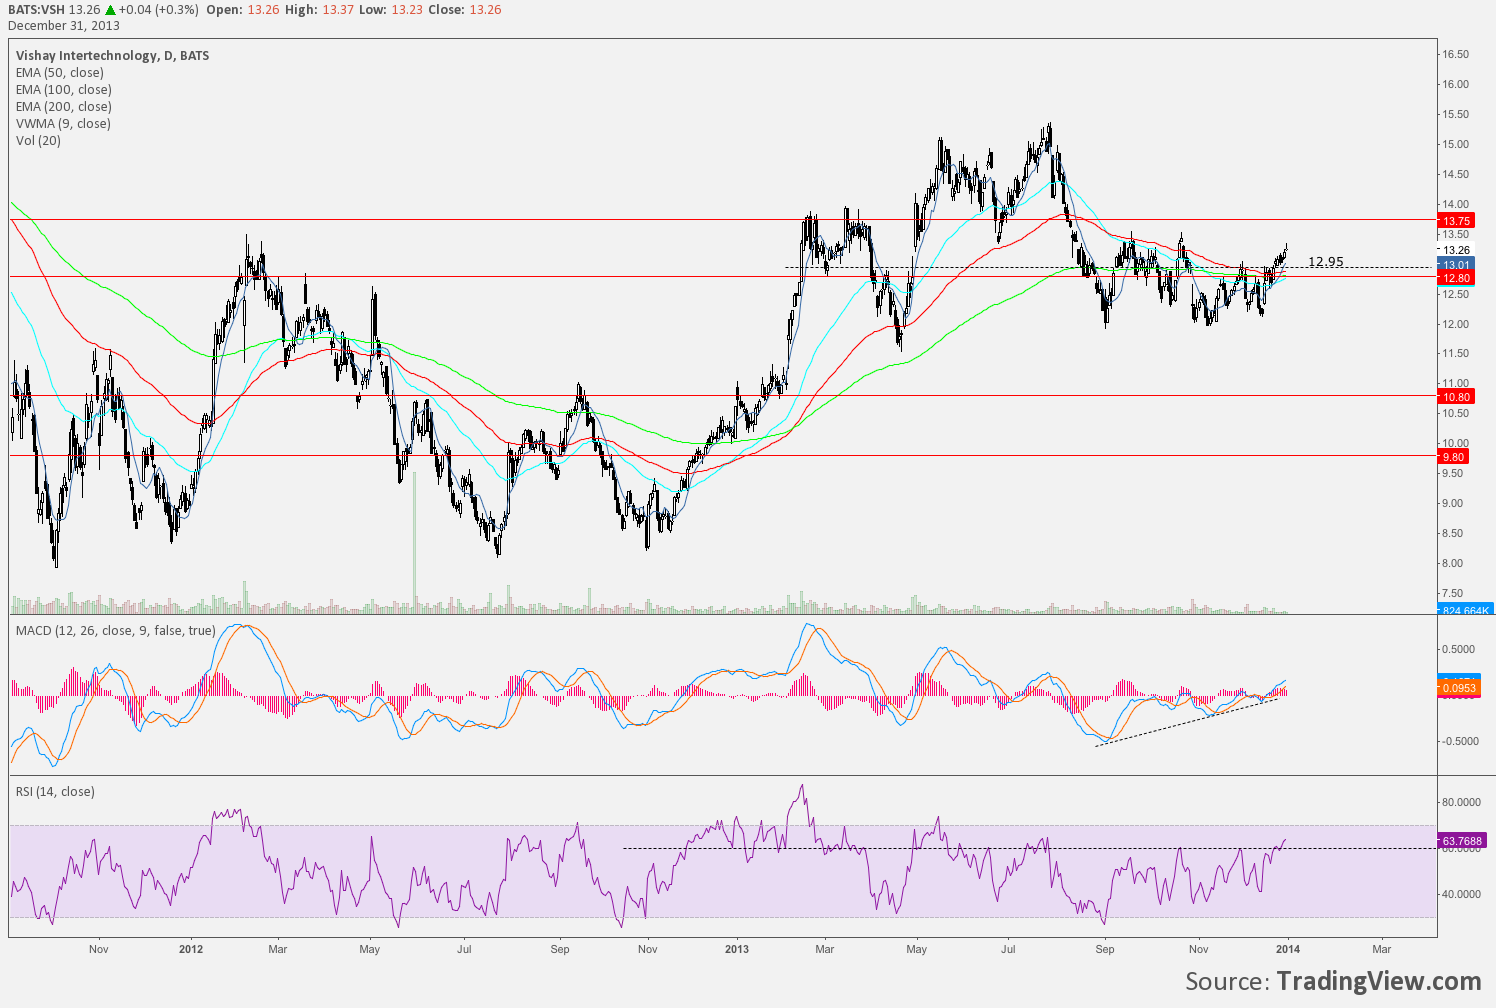
VSH – VSH daily big W pattern ended up being a great call and the stock ran to the 2012 highs and beyond. Has since corrected nicely from a small double top and a small M pattern. I believe there is setup again below new weekly SupRes- just recently shared potential on ST.
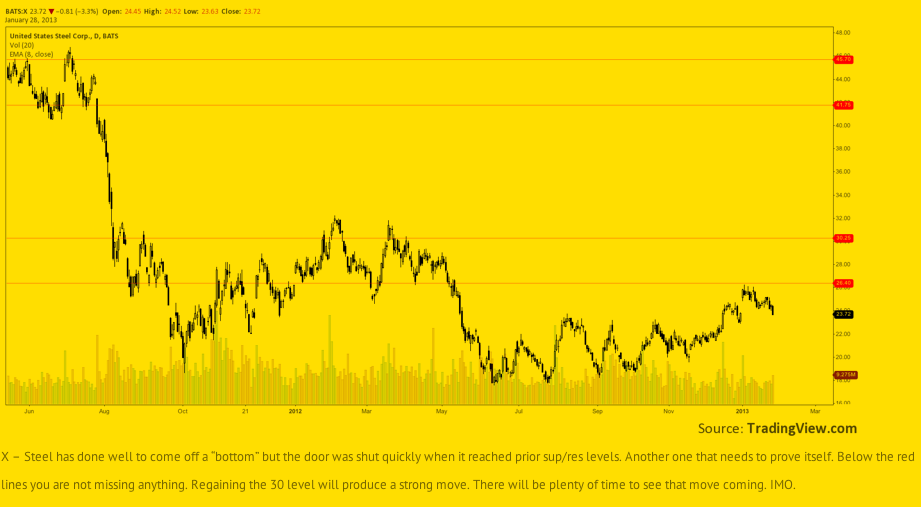
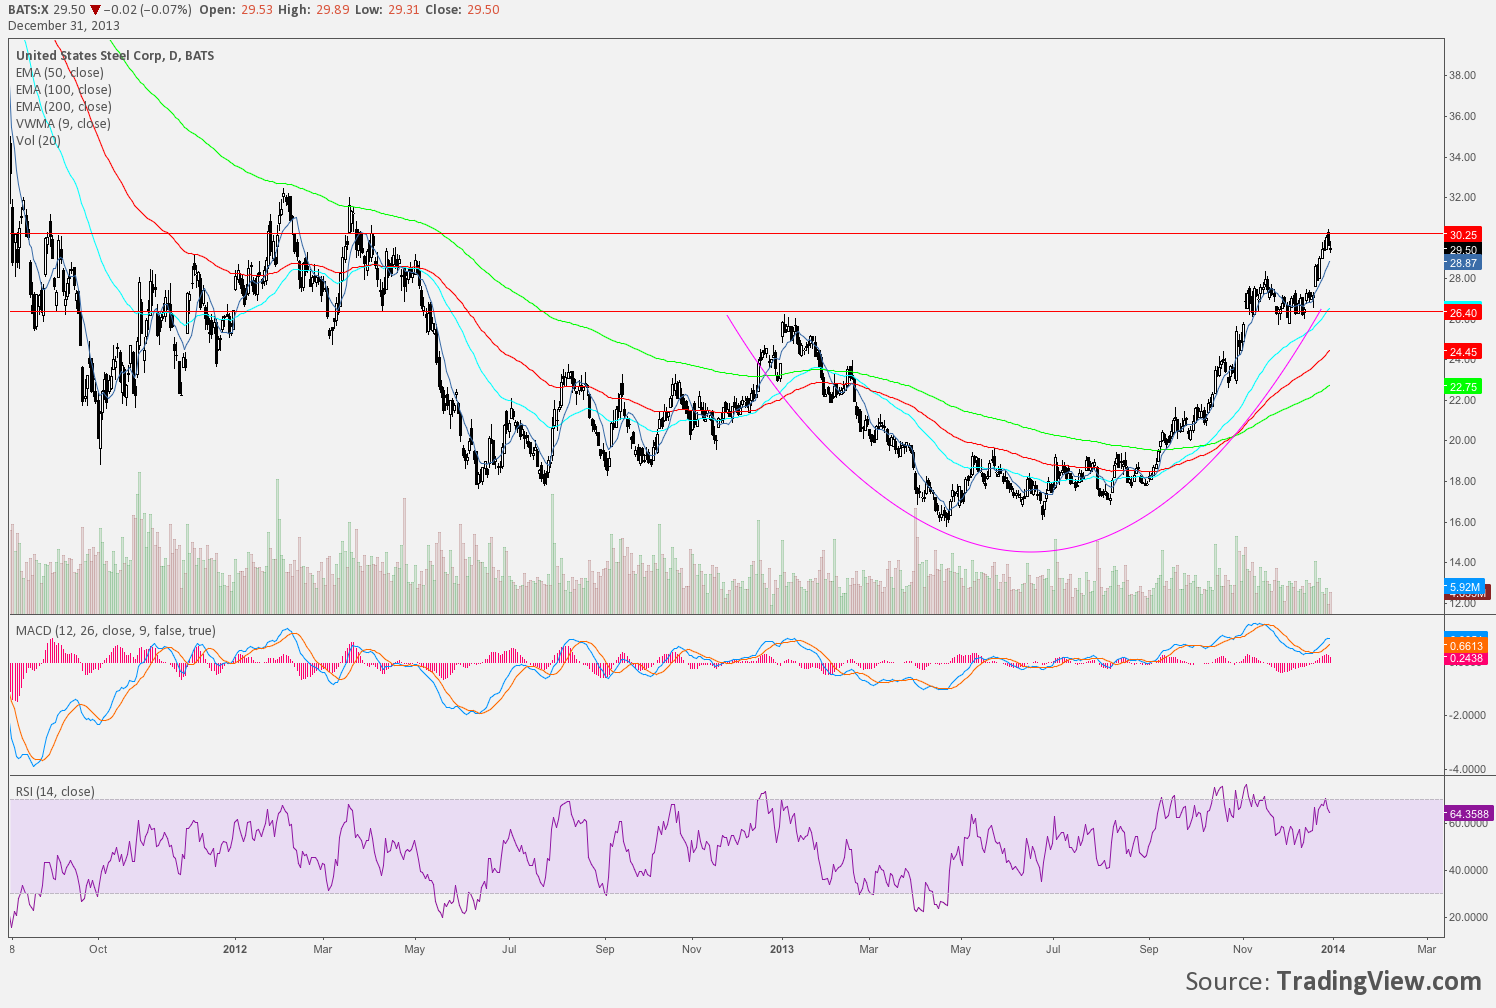
X – X chart analysis has played out nicely and acting well at perceived weekly SupRes currently. There was no rush as new lows were made and still not showing a rush although the move higher seems set in place with large cup and handle possible. Same weekly SupRes will setup the entry and exit if not already long.
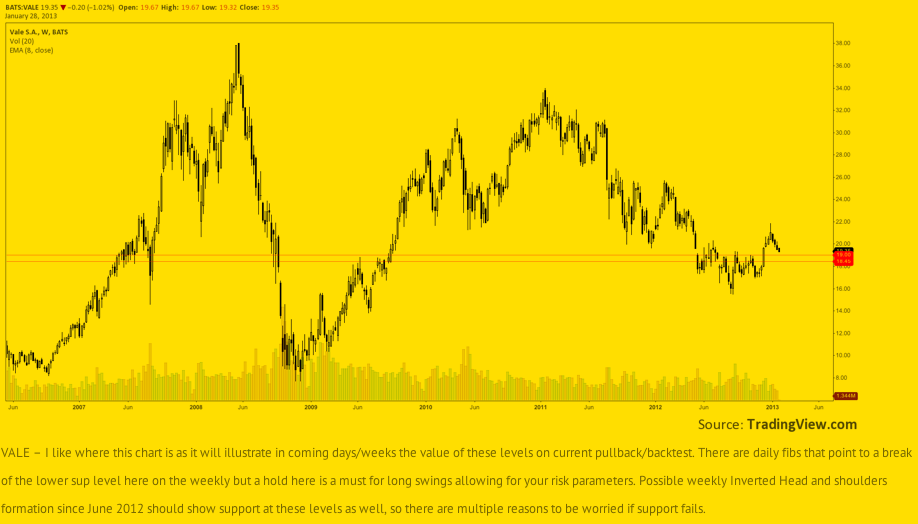
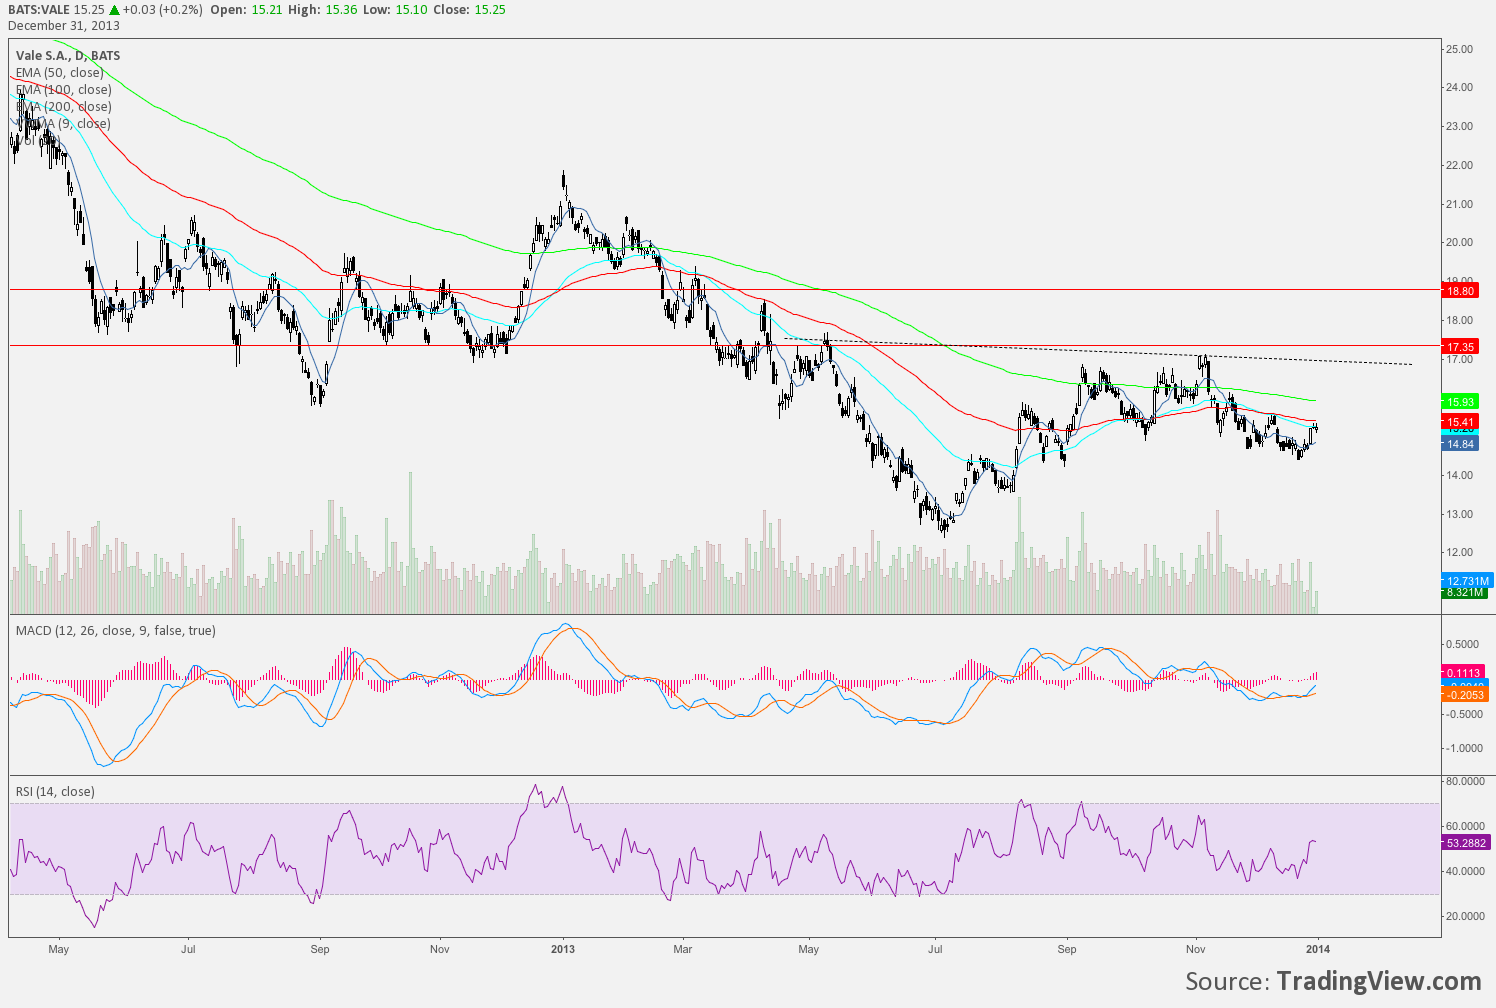
VALE – Vale showed weakness through the weekly SupRes levels. Reasons to be concerned were validated in May on sharp rejection of prior support.
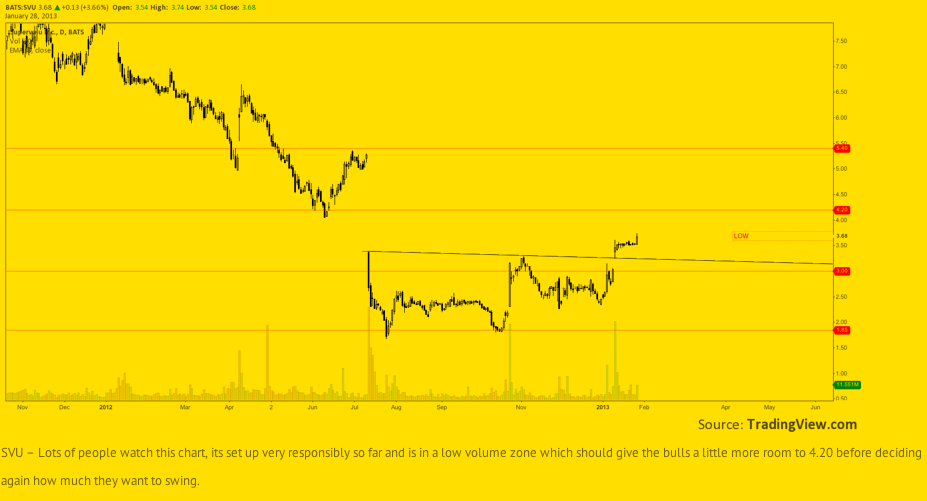
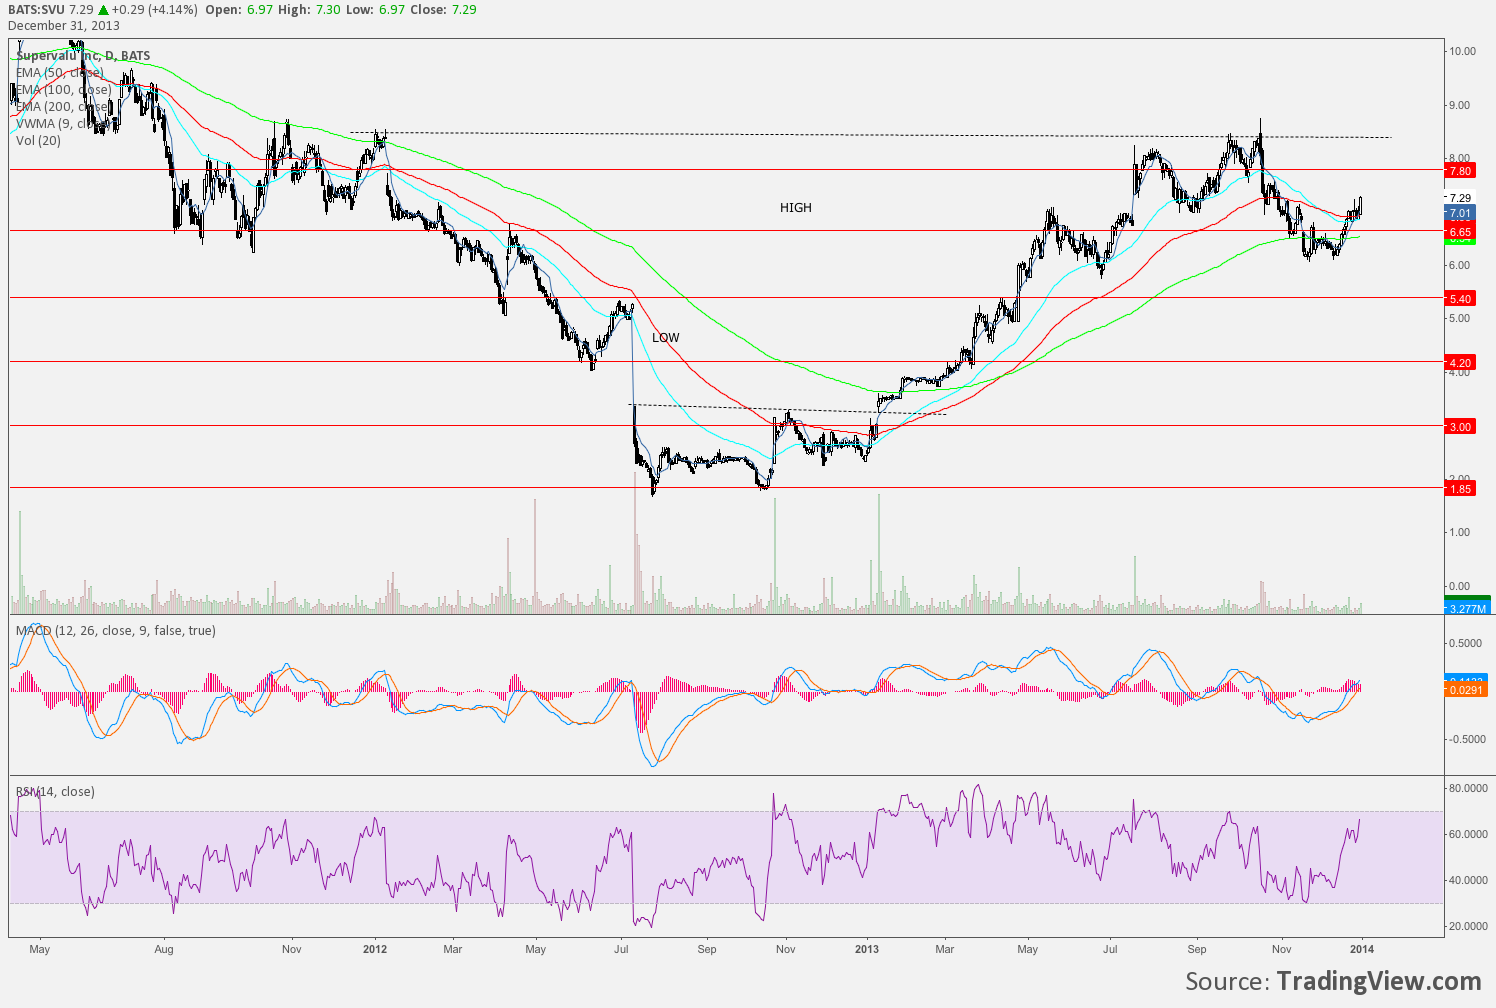
SVU – Continued to trend higher responsibly and setup well. Great run off lows noted now at new weekly SupRes showing great divergence in MACD/RSI, needs to break the highs to find space or will likely find itself in a lot of chop.
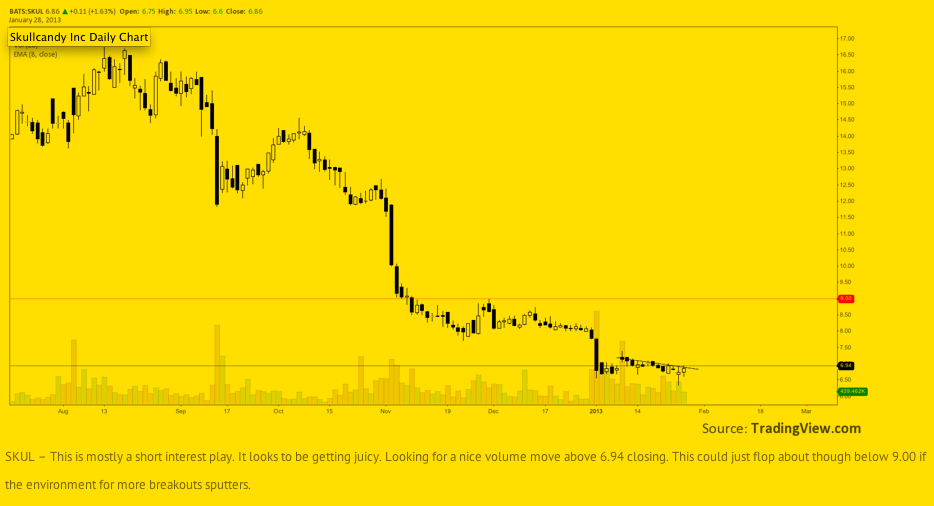
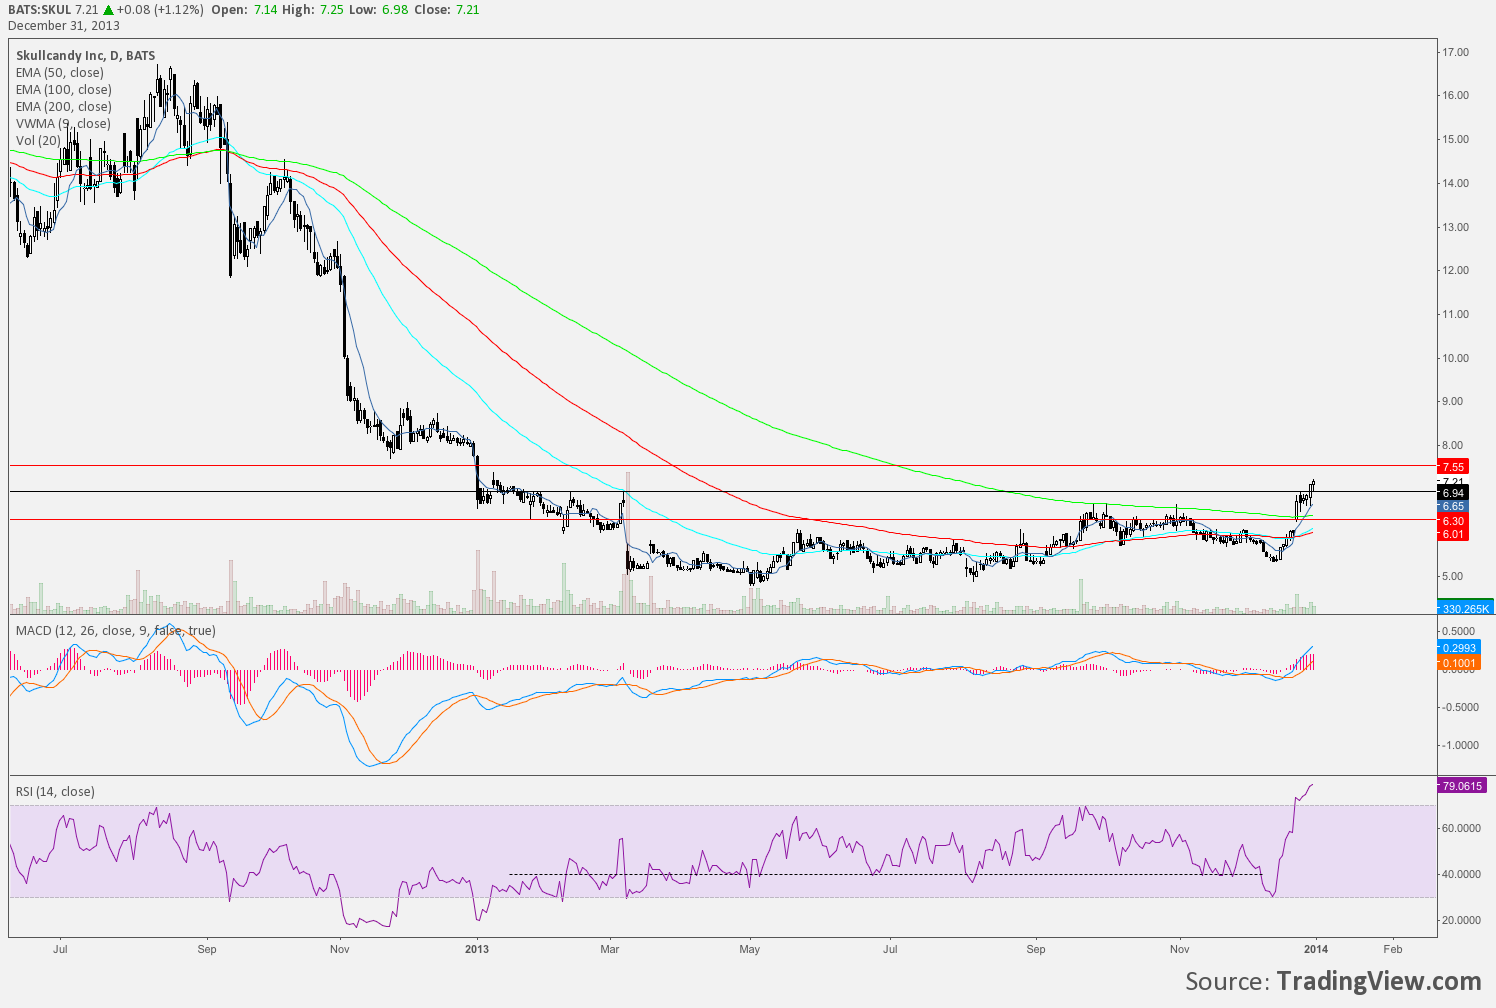
SKUL – Continued to show resistance at the 6.94 level and create large base. Just now testing those resistance highs and breaking them. No position taken. Interesting point to watch right here vs daily resistance. Chart shows why timing vs a level using price is more important than other indicators, SKUL mentioned recently on ST.
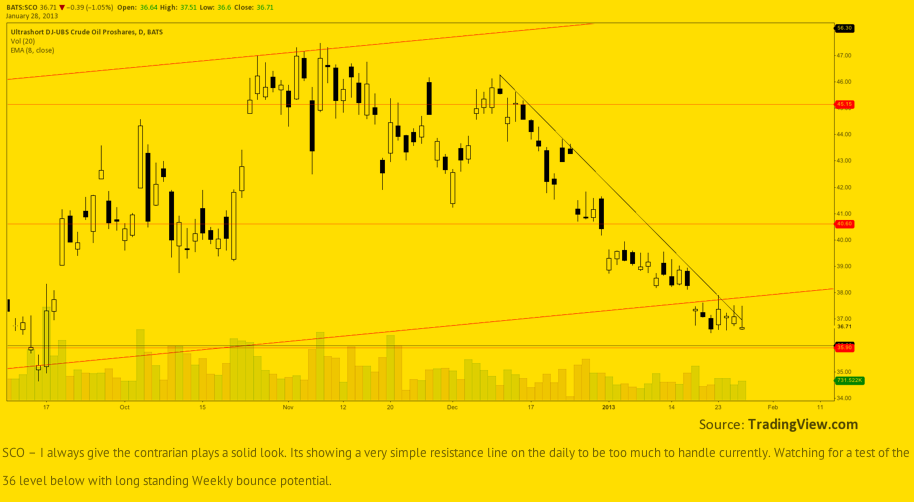
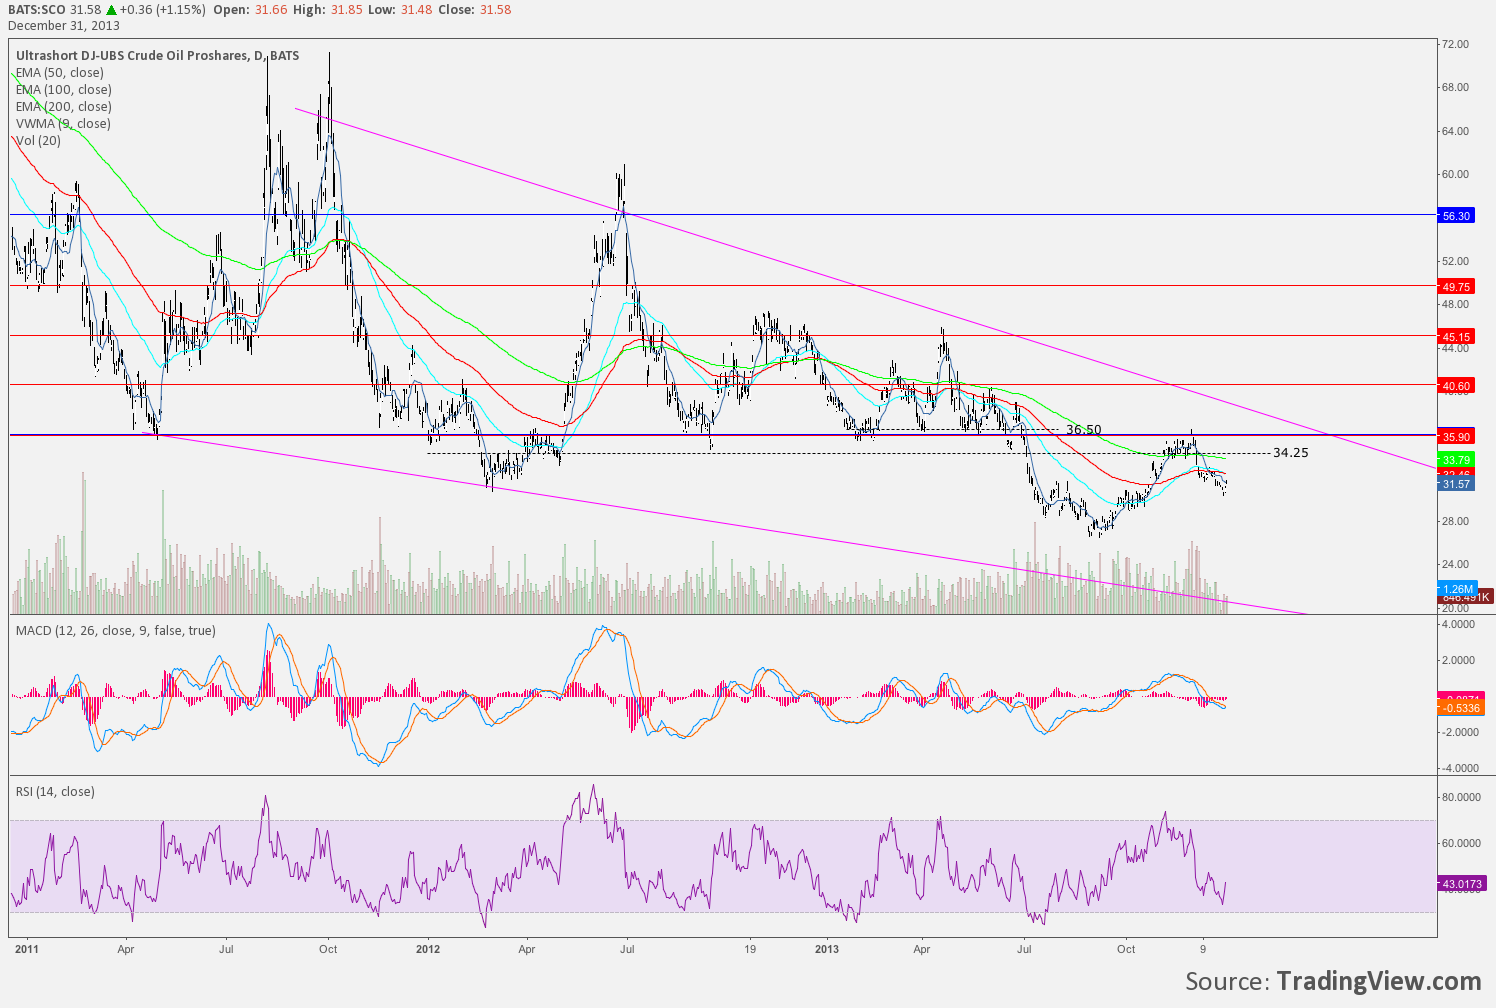
SCO – SCO contrarian play did not work out. Was positive on the trade at times but the swing ultimately did end up in a loss. Oil has pulled back to our entry on SCO but this trade/chart has not been revisited.
SCO is currently holding sideways as RSI breaks 40 in a weekly falling wedge pointing lower and the 36.50 level seems to now be resistance. Prior post outlining SCO thesis/trade here.
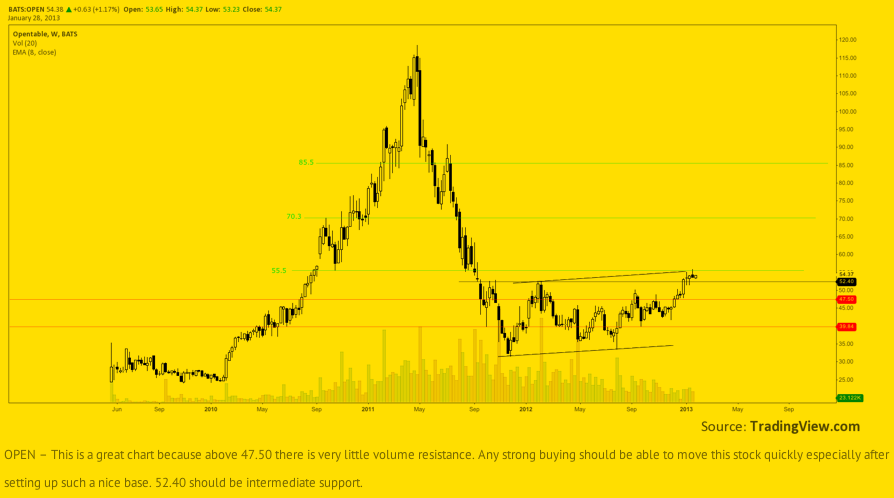
OPEN – A great trend highlighting the light resistance anticipated. Has just recently pulled back from the highest projection area of 85.80. MACD is showing a new high but RSI is diverging.
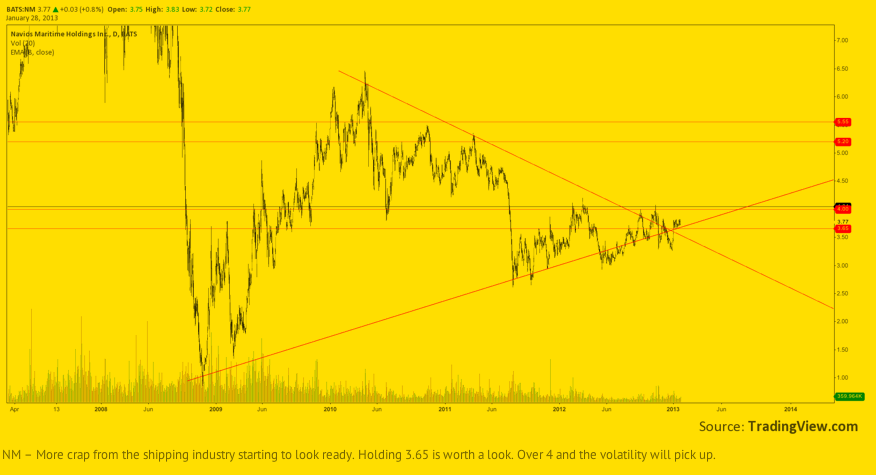
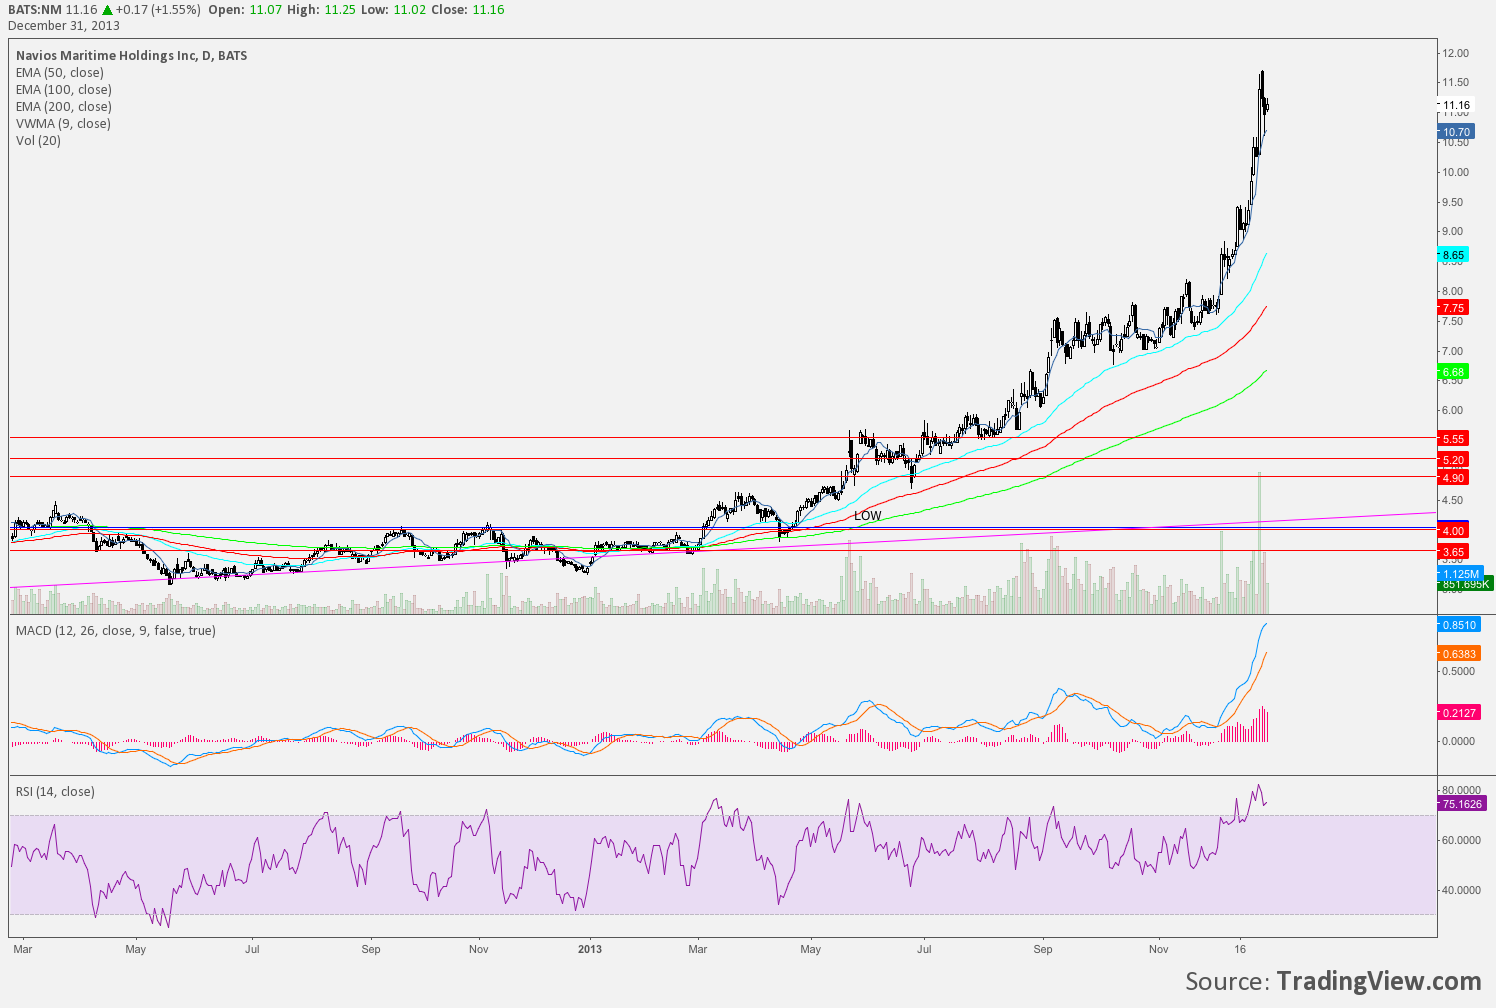
NM – Indeed, the crap from the shipping industry was largely ready to make a move. Holding 3.65 was spot on as it just traded 11.73 last week. Hardly ever looking back, it only touched the 200DMA once after its final test of 3.65 in March.
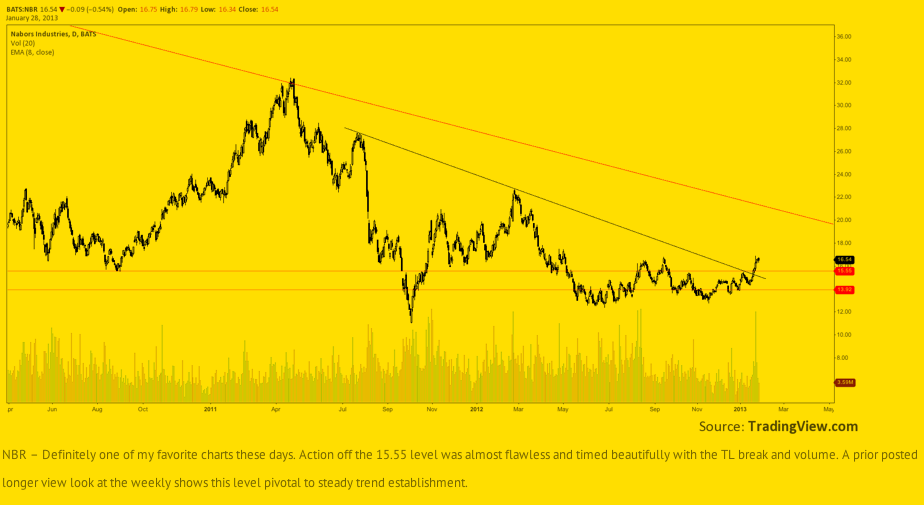
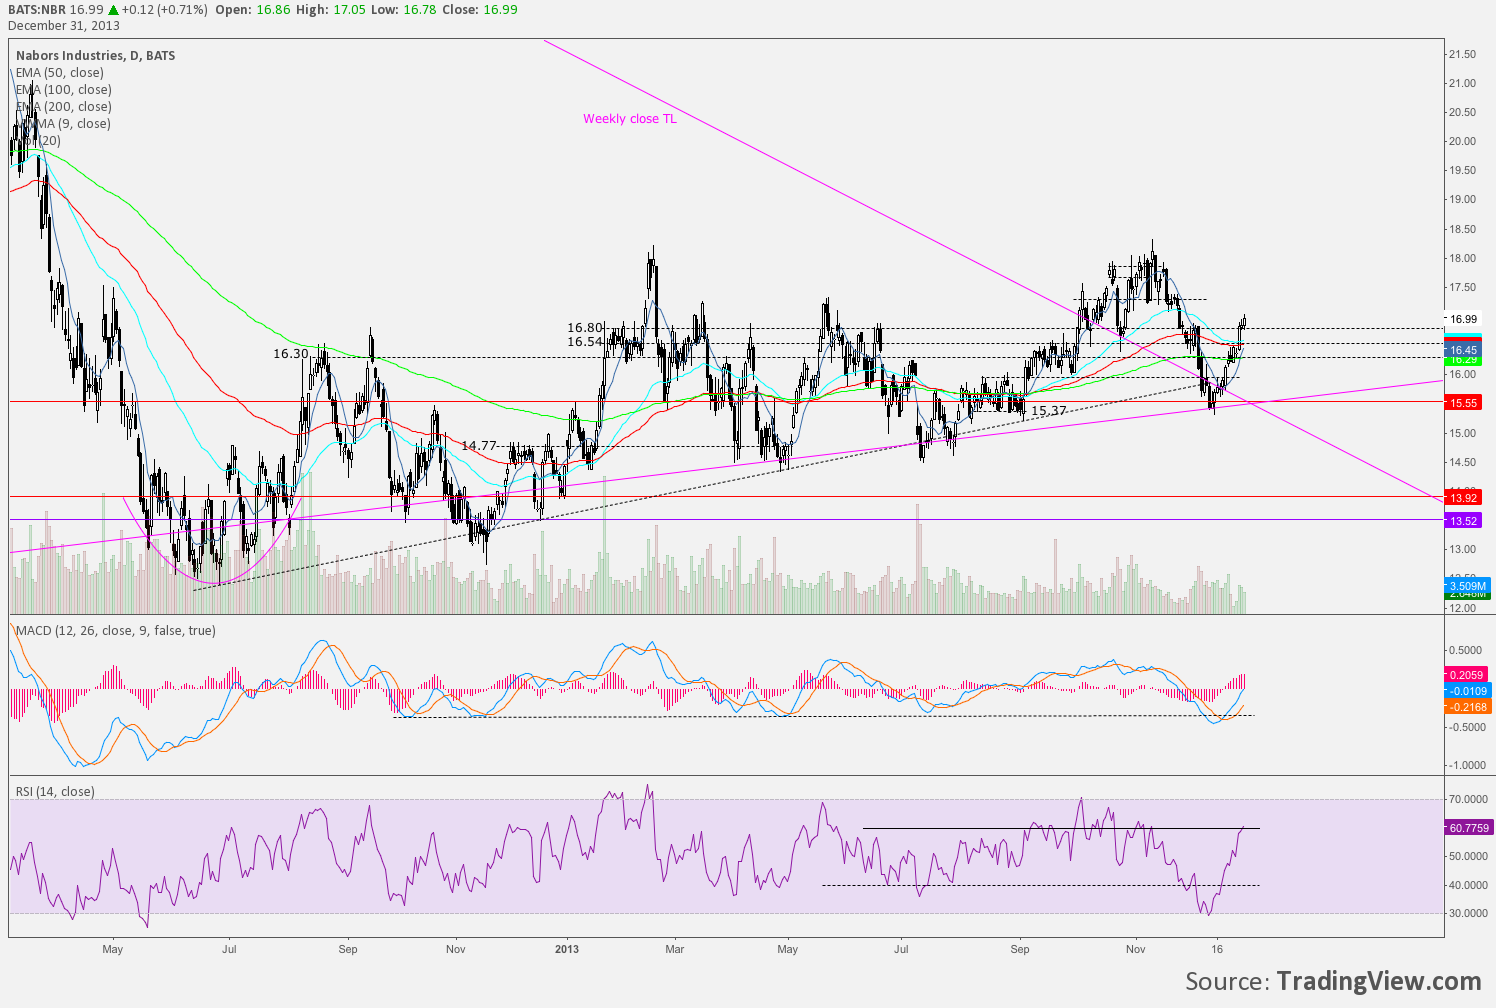
NBR – Was a favorite setup. I waited patiently for this one and nailed a turn. I didn’t protect my profits well, I had my targets much higher than the initial push and certainly didn’t expect a FULL retracement.
Not yet re-entered. The 15.55 level was STILL key on latest selloff. Posts on NBR trade here.
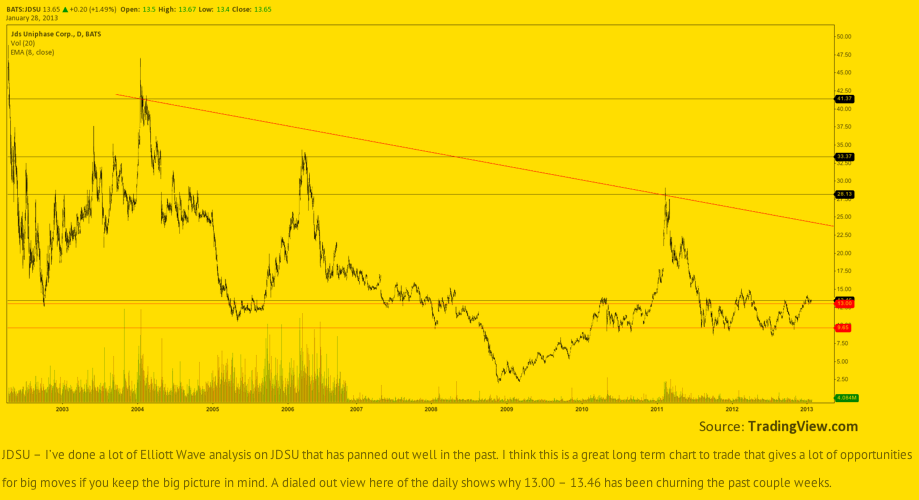
JDSU – SupRes levels ebbed and flowed throughout the year as a weekly breakout setup. Very volatile to its highs and lows but never reached potential.
I took a shot recently and got shook out prior to the biggest volume day since 2010. Prior levels still working as resistance currently, this was a dip buy. Has run nicely as anticipated but currently getting tangled in the MAs. Not yet involved.
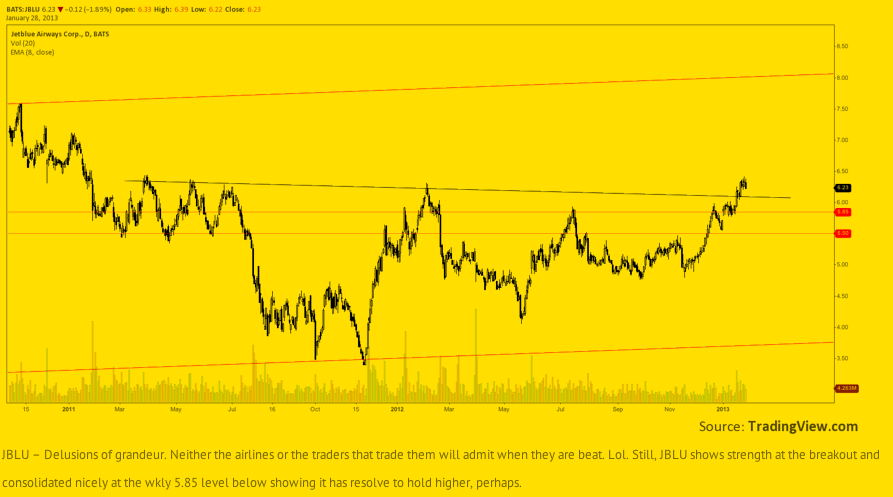
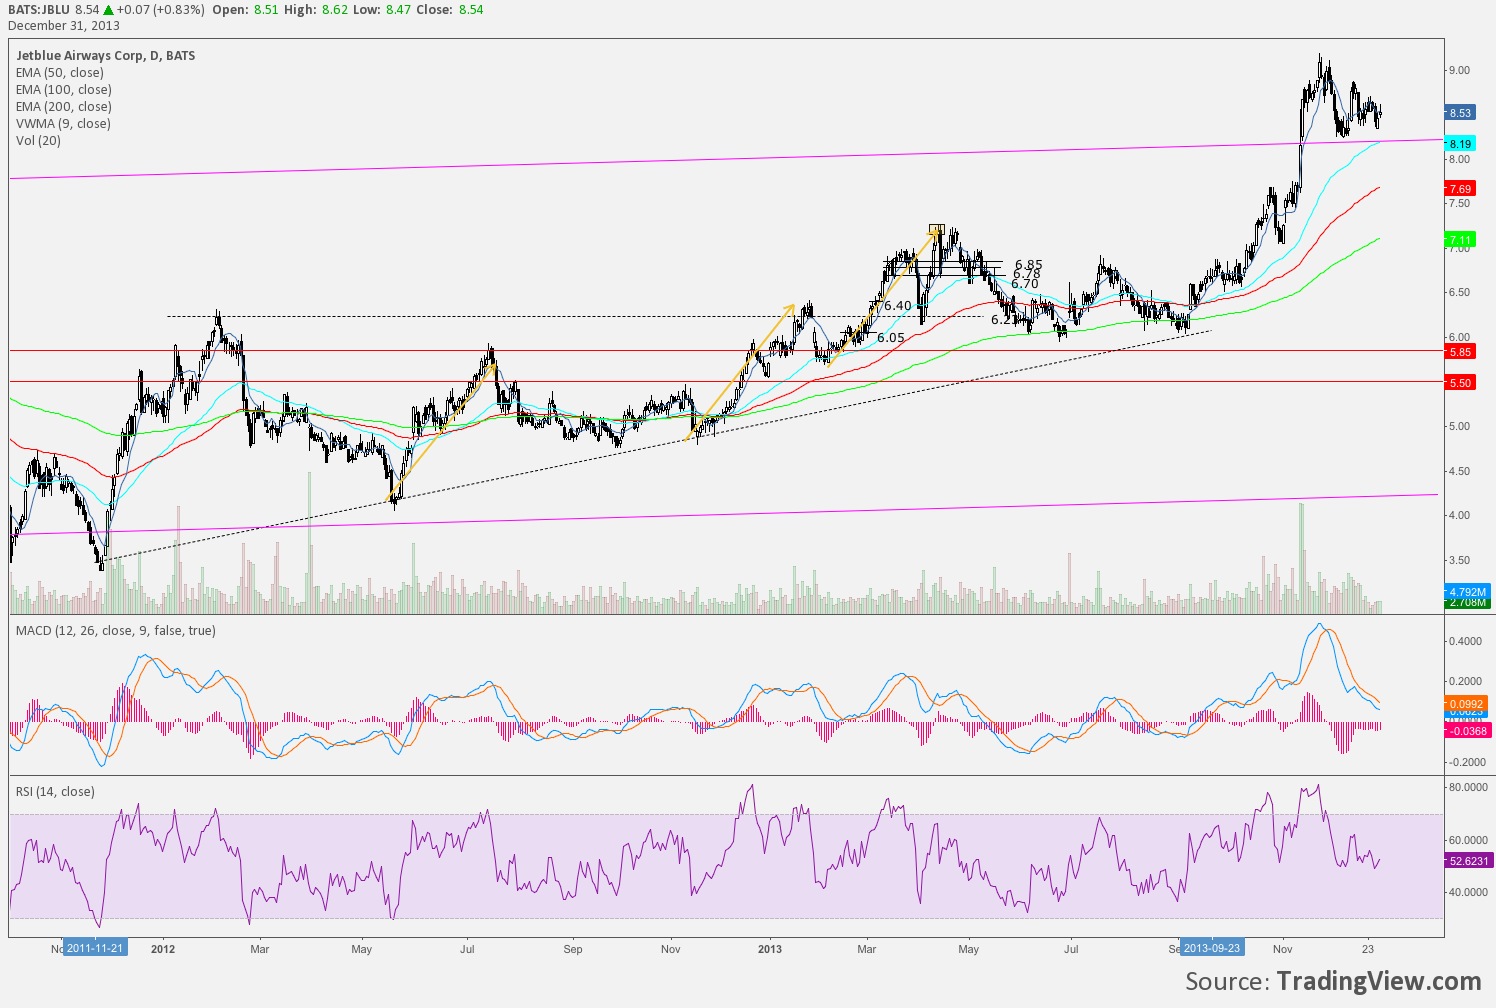
JBLU – Has done well making long term dreams come true. I took JBLU for a gain from 6 -6.60 before a high of 7.20s and a long period of choppy consolidation back into the low 6.00s has allowed this stock to move higher.
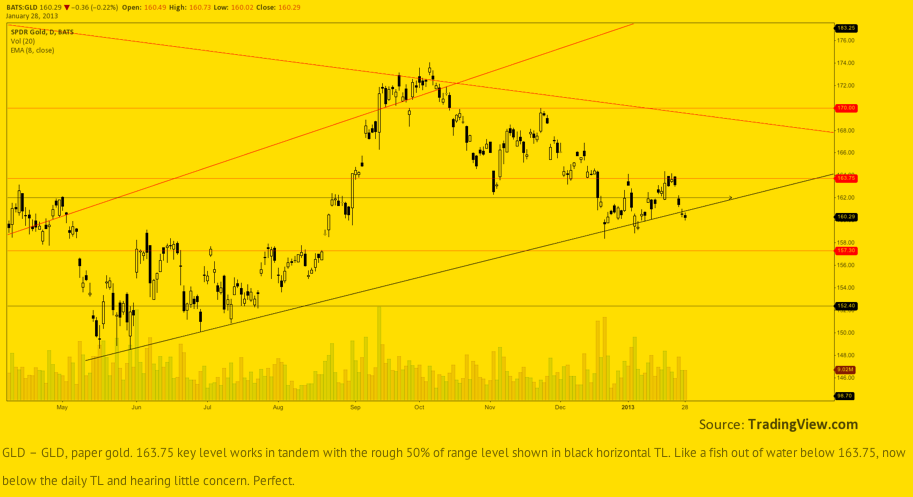
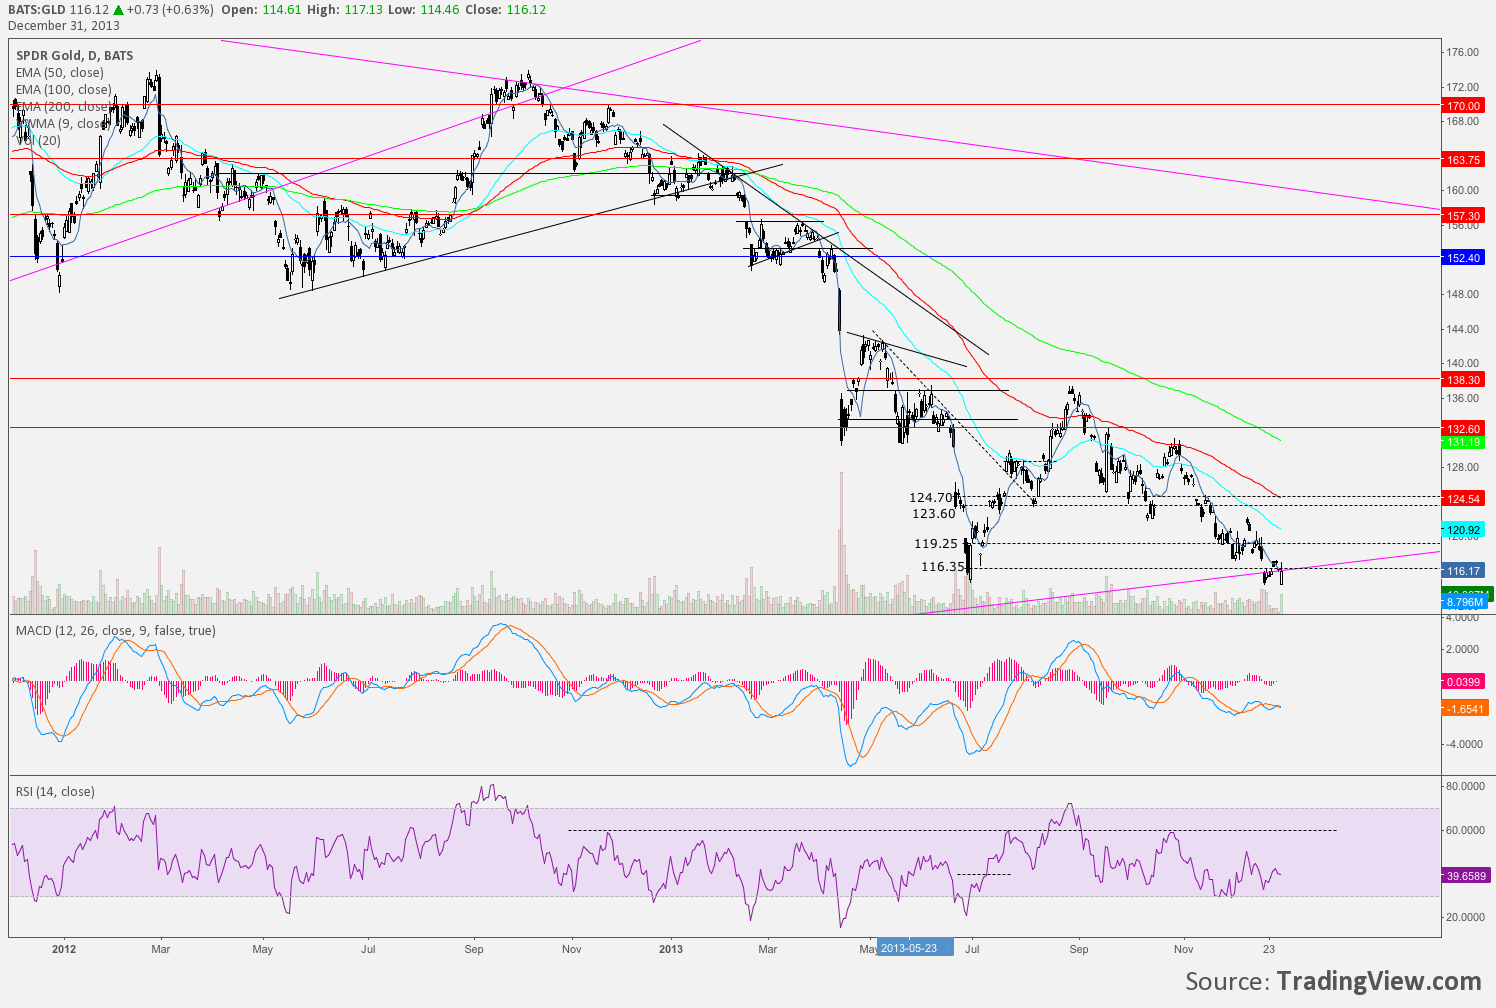
GLD – I used DZZ to short GLD. It was by far the best trade of the year, the longest trade and one of the greatest learning experiences of the year as well.
It was almost too hard to let go of the emotional side of this trade being on the profits side of misguided sentiment for so long. I don’t have a stance/position on gold right now. It certainly looks heavy and is in a downtrend.
Other posts on GLD available documenting trade.
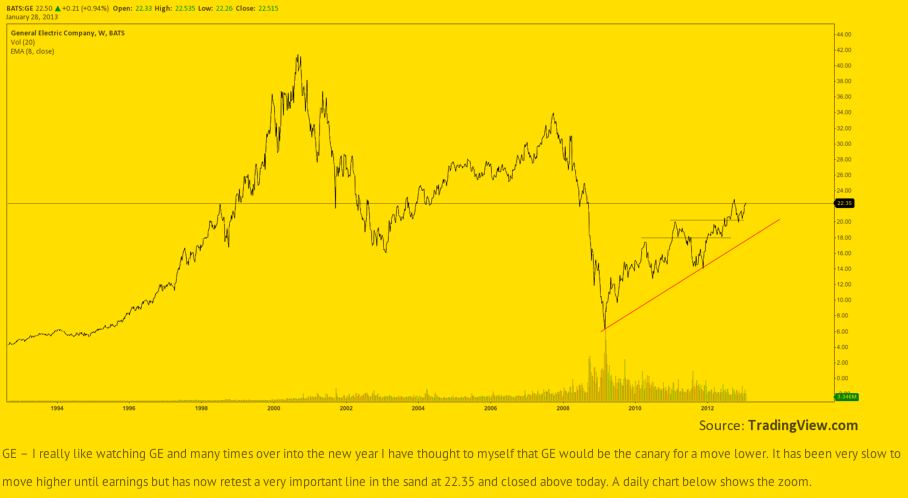
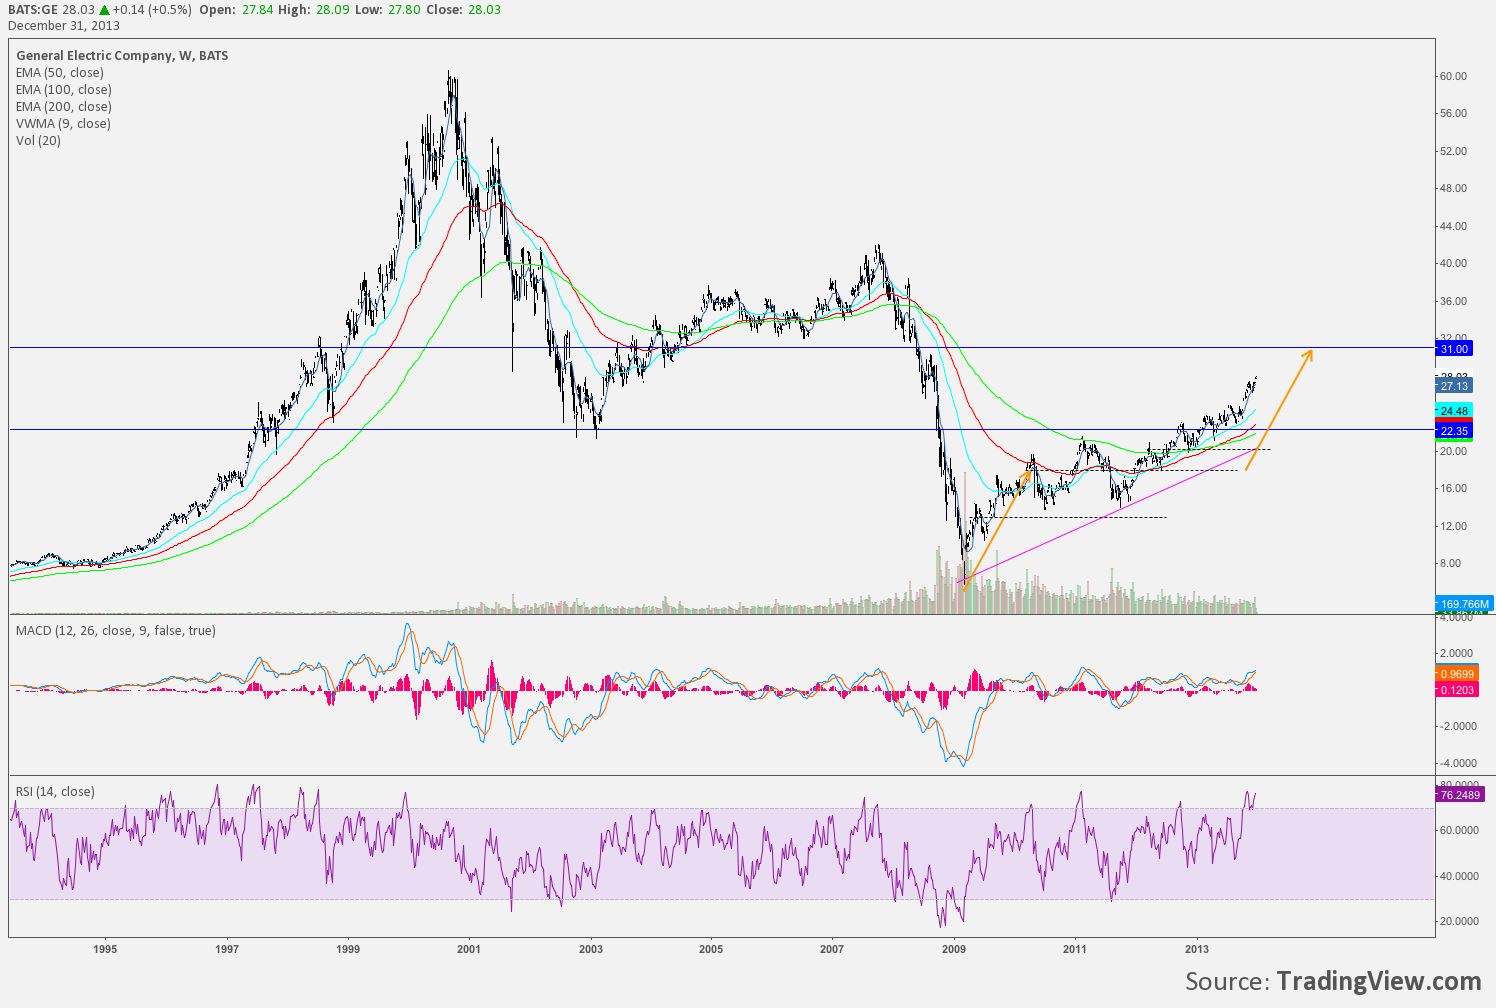
GE – Was going to be the tell in market direction. And it was. But very large gaps above and below SupRes 22.35 whipsawed sentiment and positions before the trend higher was established. Looks headed to 31.
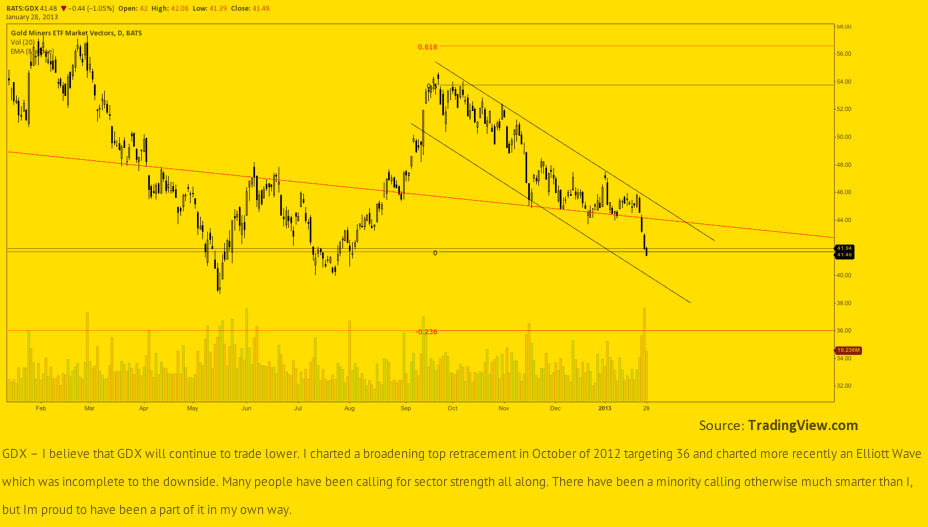
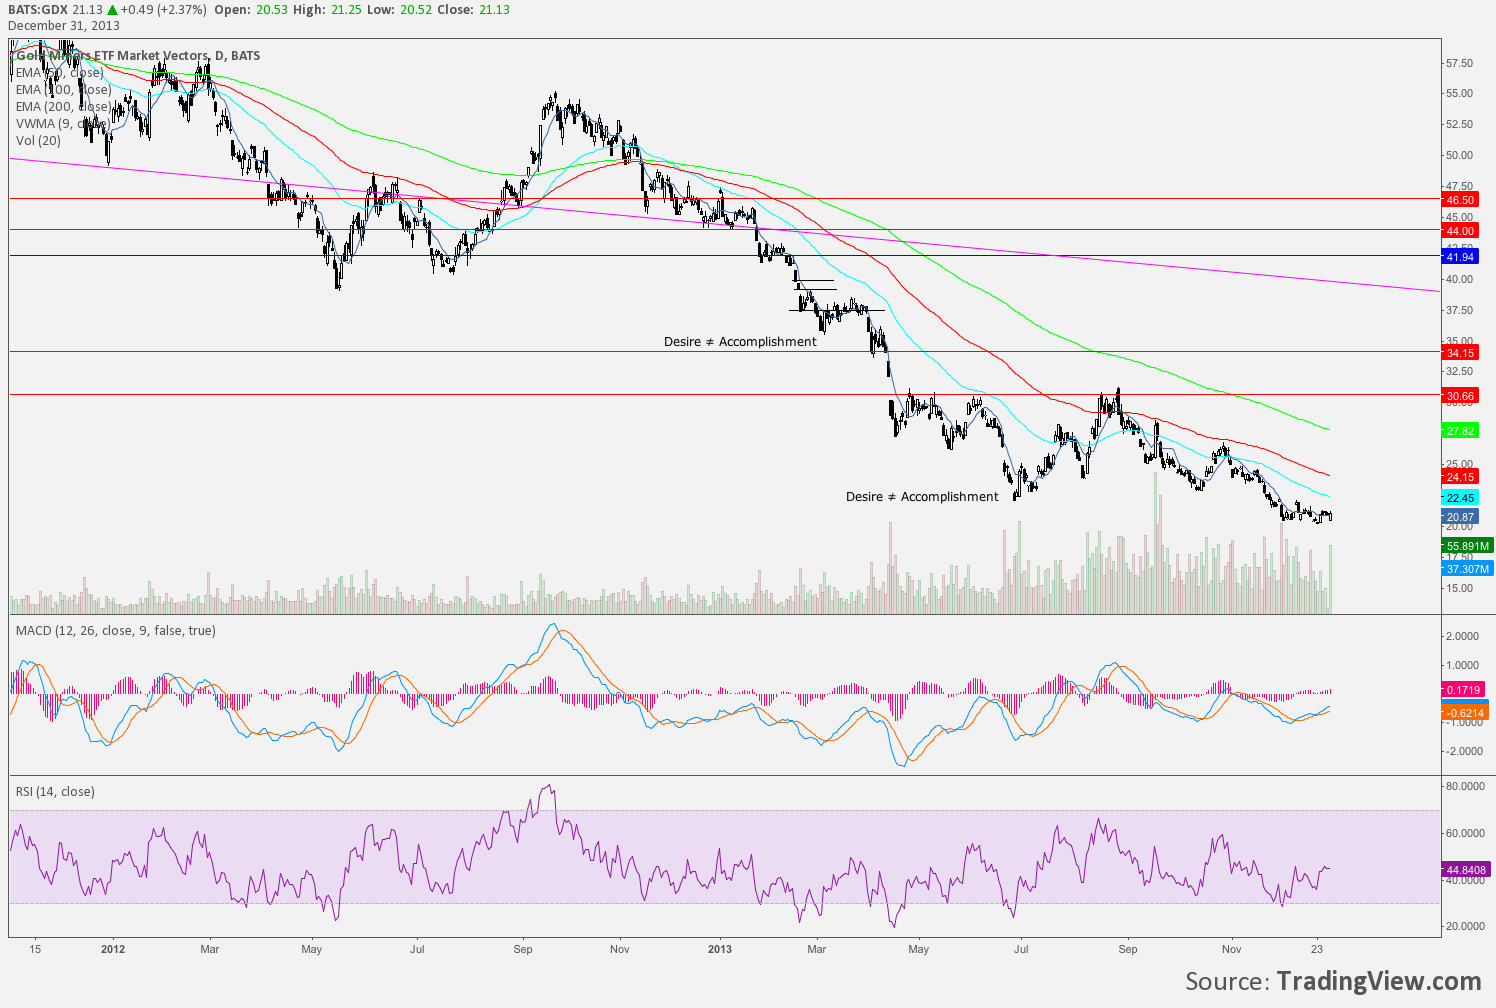
GDX – GDX went hand and hand with my gold trade. The setup was contrarian and perhaps still is. Jan 2013 chart and analysis of 41.94 was spot on.
For most of the year I paraded the ST stream with charts like it sure looks good but not to me and “Desire ≠ Accomplishment”.GDX certainly hasn’t accomplished much but to go lower. All expectations exceeded.
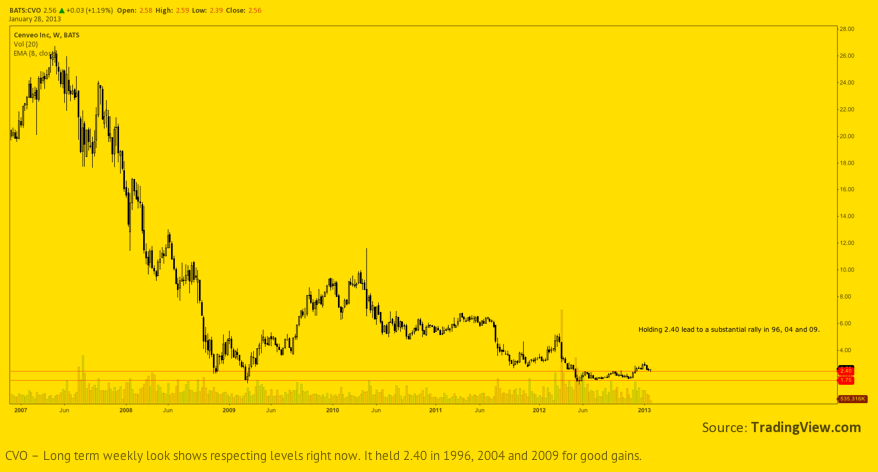
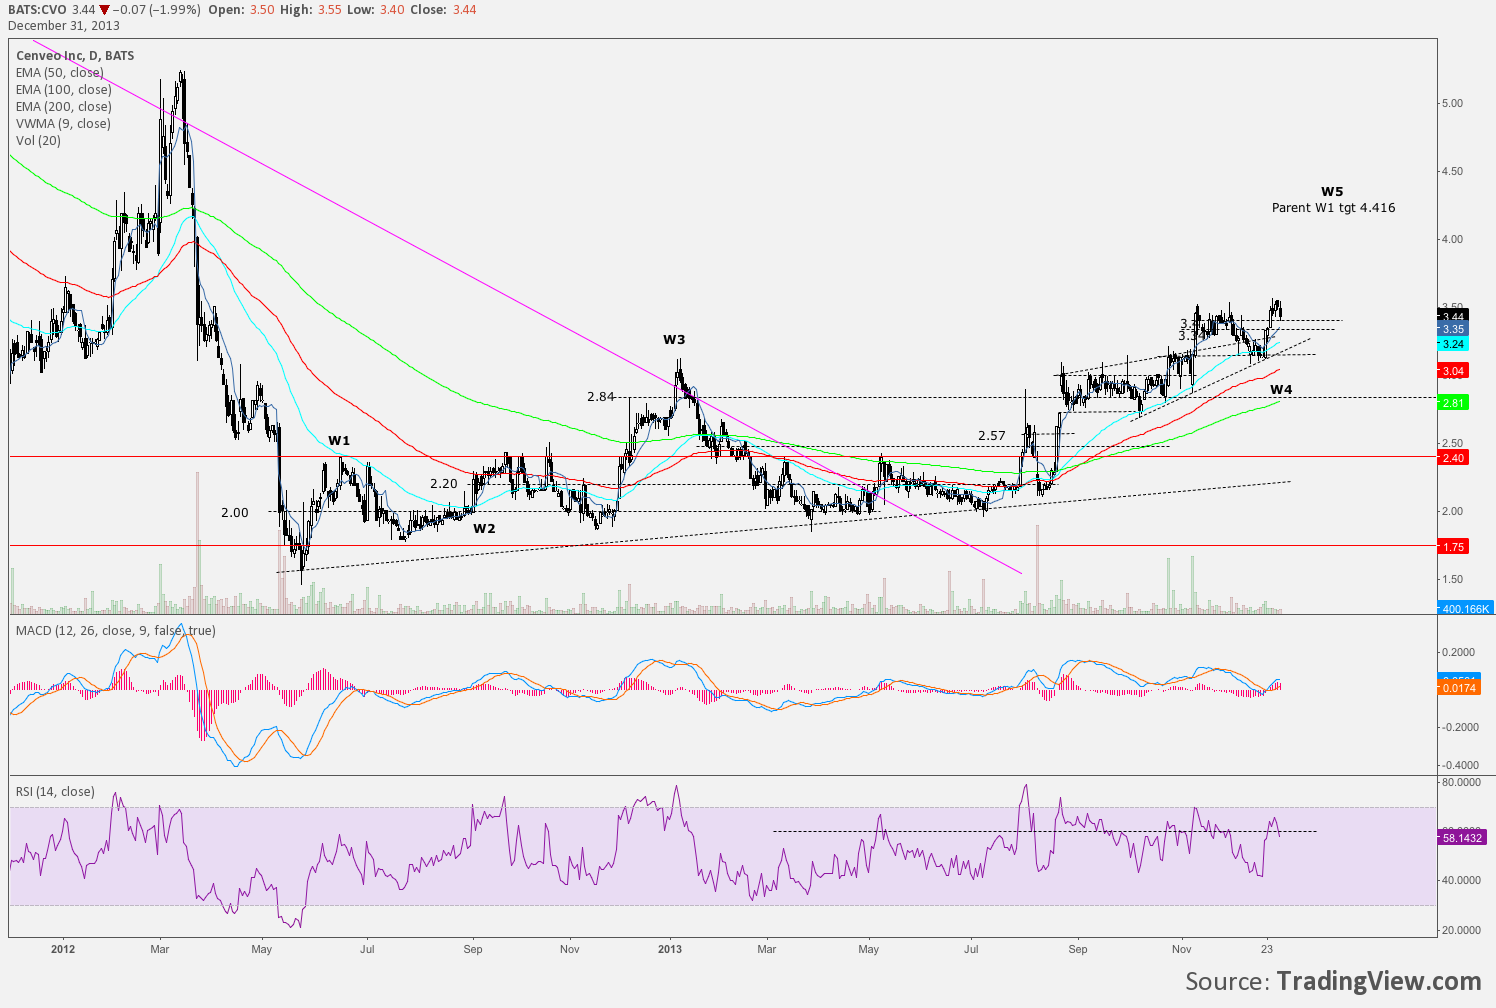
CVO – I got whipsawed out of this one but it settled down long enough to be comfortable with re-entering. Could be long in the tooth, certainly seems cranky between levels, never not an ugly candle far behind, but it has gone higher and is still above 2013 highs.
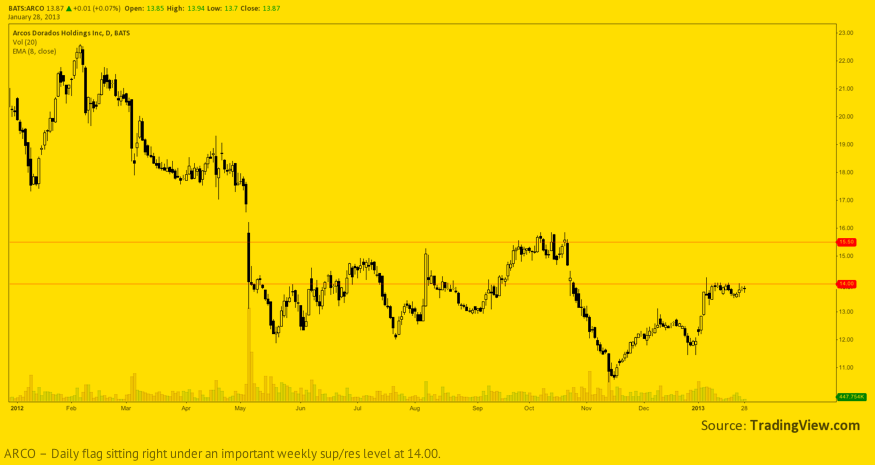
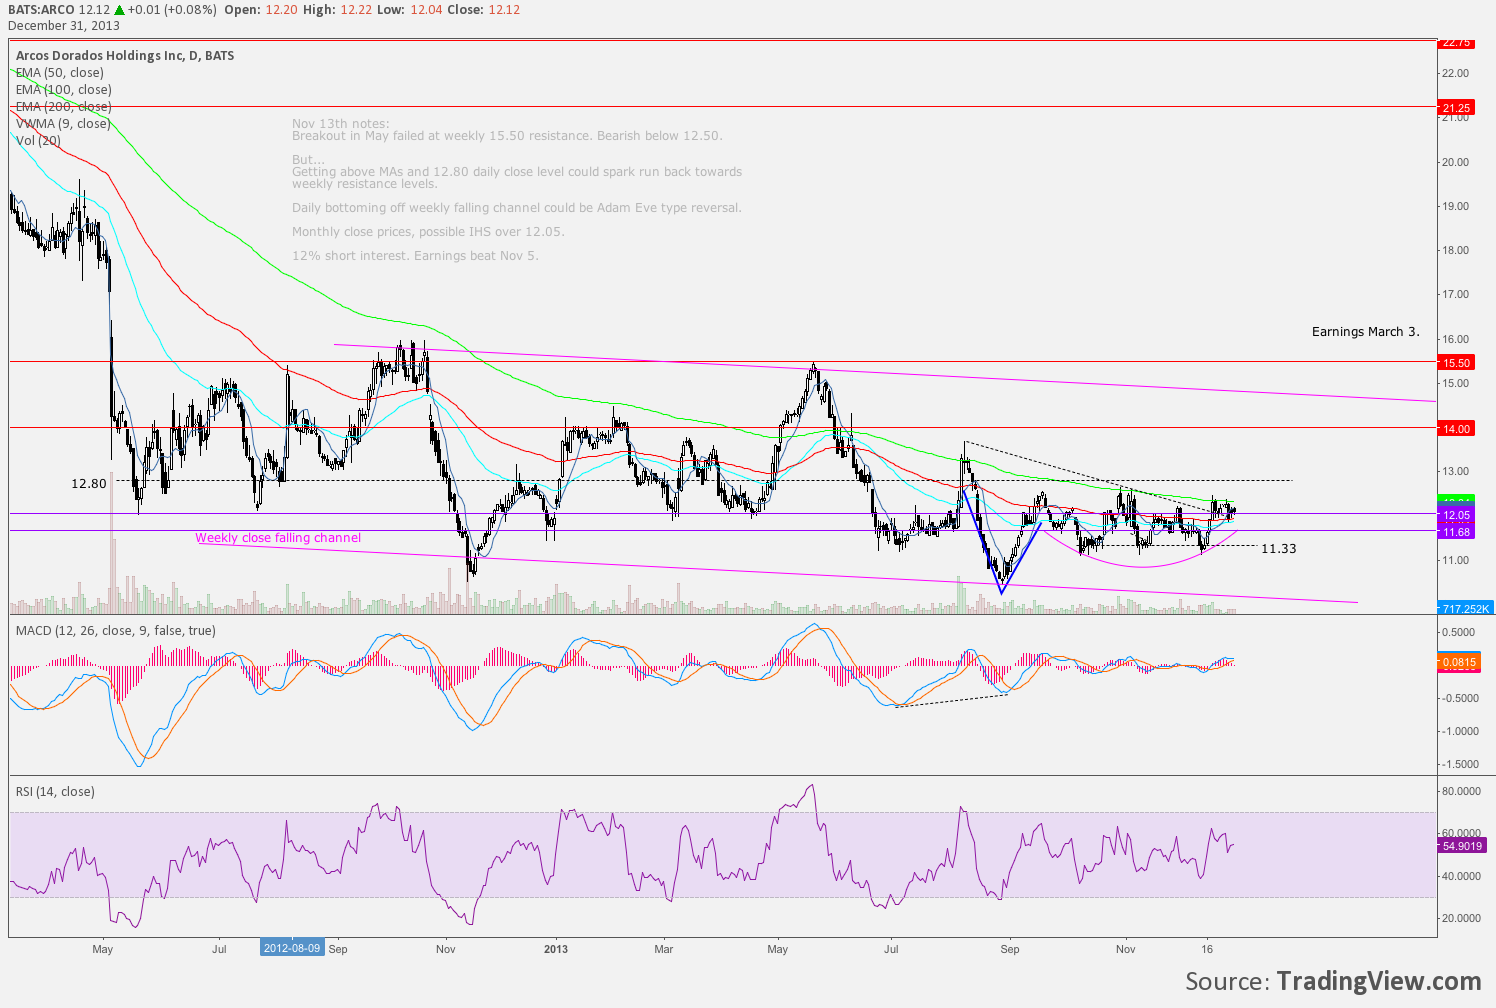
ARCO – Did eventually make a nice run higher but did not hold up well to the weekly SupRes to trend higher. However it has found itself in an interesting bottoming pattern of late that Im monitoring and posting charts on. Worth noting again. No position currently.

