|
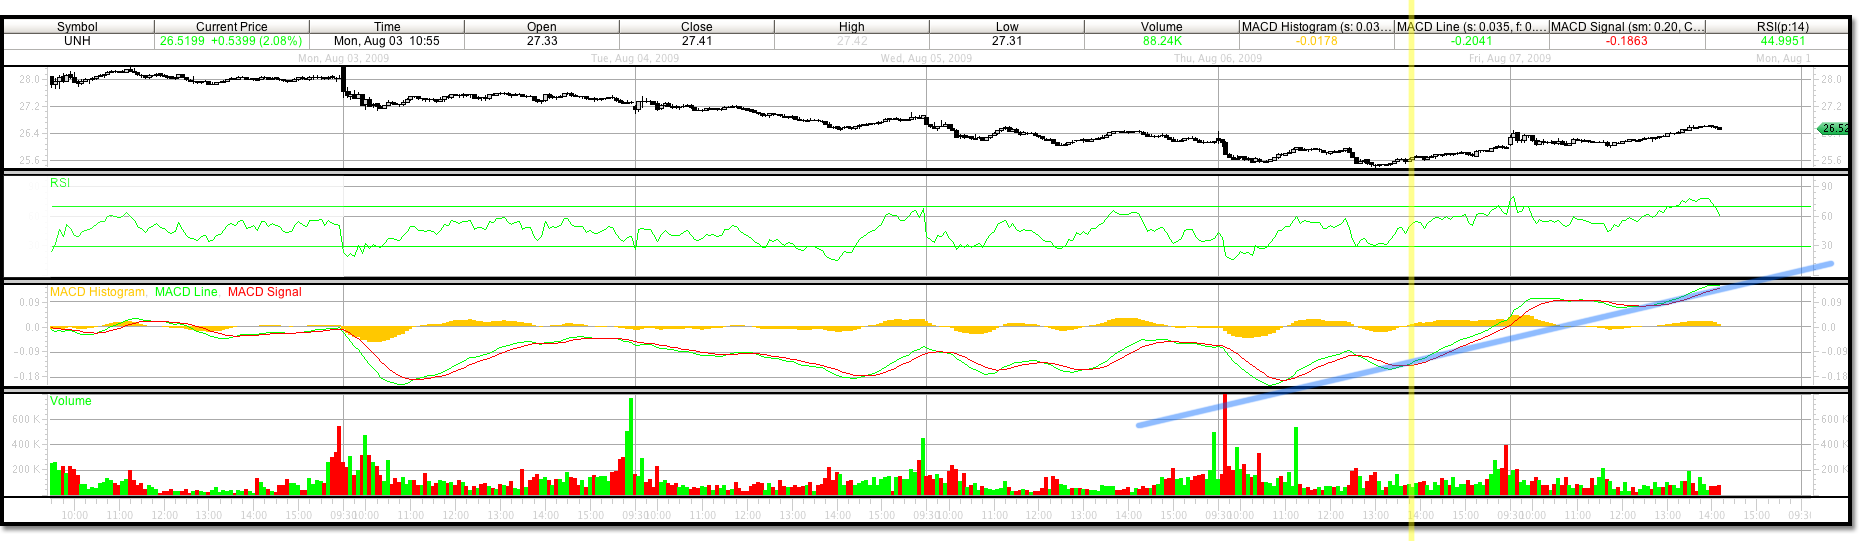
Buy trading signal triggered on UNH on Thursday August 6, 2009**.
|
| UNH- Buy signal triggered on UNH on Thursday August 6, 2009* | |
| Trading signal for 5 minute price bars | |
| Buy price: $25.68 | |
| Sell stop price: $25.41 | LEVEL HIT – September 25, 2009 |
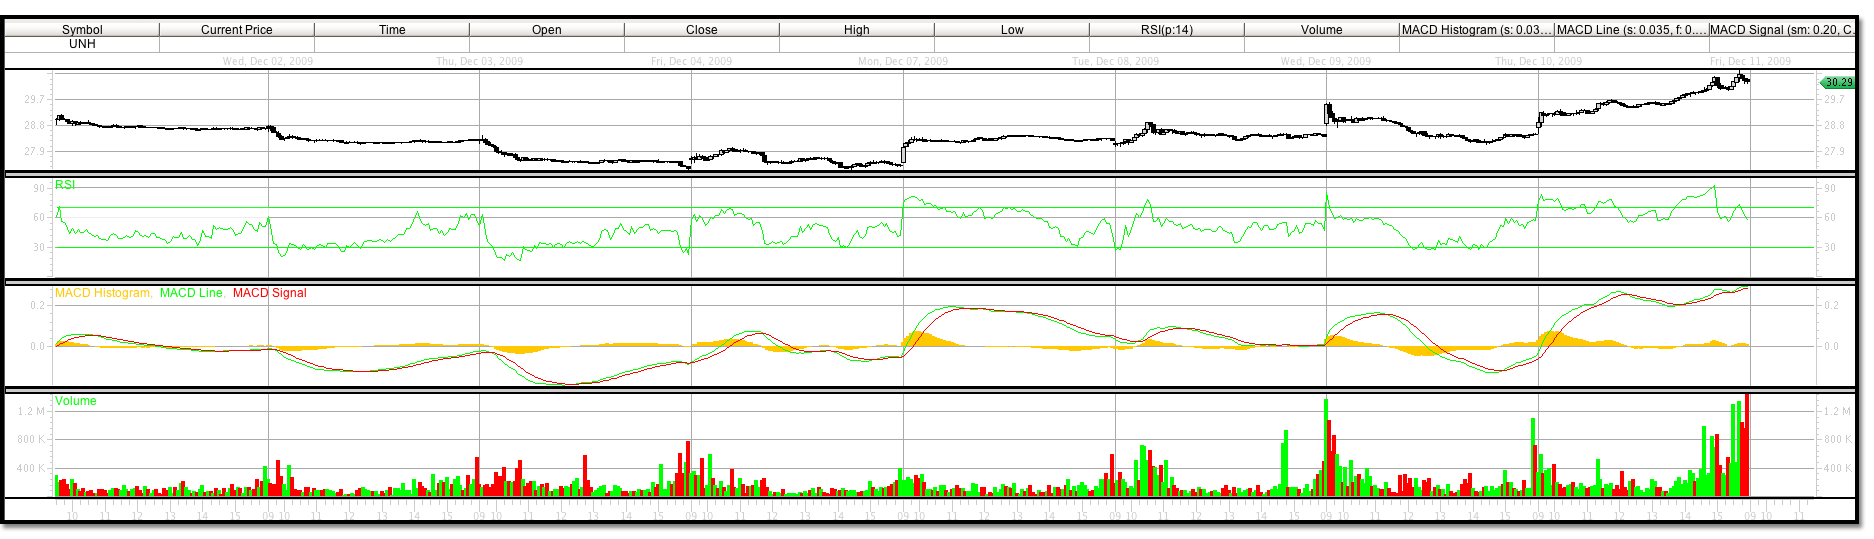
| Short term profit level: $30.25 | LEVEL HIT – December 10, 2009 |
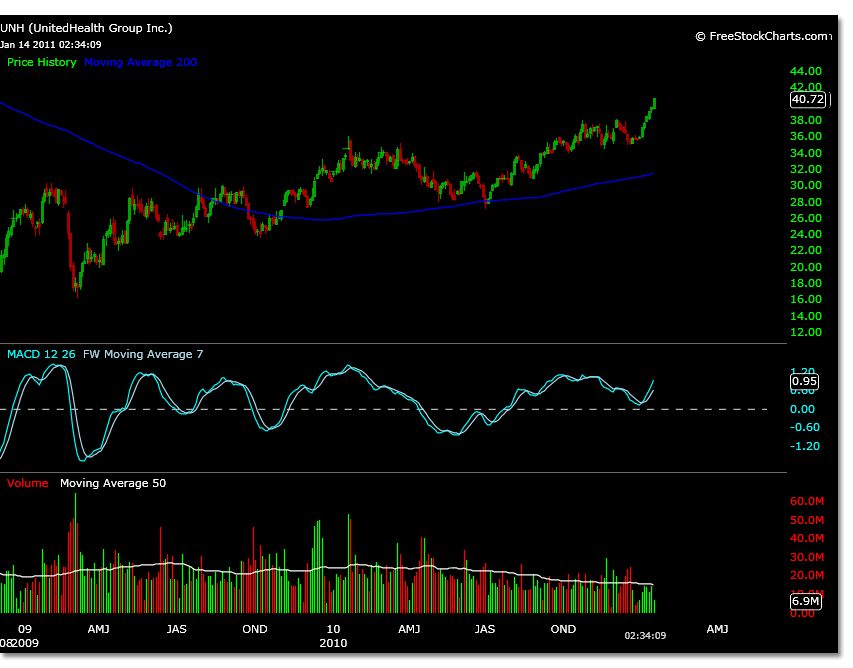
| Long term profit level: $40.00 | LEVEL HIT – January 14, 2011 |
|
Today’s trading triggered our sell stop level. Looking at the trading action between our buy signal and todays date however, we see that our short term profit level came close to its sell level. Trading off this level revealed a double top that we can see in the daily chart above. On August 25, 2009 UNH reached 30.00 and on September 17, 2009 UNH reached 29.88. This second retest could have shown the short term trader, keeping an eye on intermediate time frame trading stops, that the resistence at 30 was strong enough to take profits and re enter the trade at a lower support level. Look for UNH to test the level of 23.69 of July 6, 2009 before heading to higher levels. |

UNH has been trading close to the news on health care reform lately, and since our last call to watch for a test of the 23.67 price level, UNH has now bounced from that trading level at 23.50 on October 8, 2009. The trading has been violent at times, however it seems as though UNH may have its near term price lows in. After trading today to a low of 23.96 on news that health care reform had breached a major hurtle, UNH closed at 24.29 two cents off its 62% Fibonacci retracement level from the March 8, 2009 low. This could have been good buying opportunity. If you want to enter UNH again use a close sell stop level below 23.49 and look for profit levels of 28.02 and 30.80 if this bottom holds.
A new trading buy signal will track this possible move. Visit the trading alerts page or use this link to view the UNH buy signal for October 13, 2009.