It’s hard to find a day in the markets when the speculation on health care reform is not taking a new turn. However, with the latest passage of the new reform bill in the House this past weekend, you would think that the market weakness or volatility in this sector would continue. Today, it did not for the most part.
Many believe that the bill will not be as easily passed in the Senate as is, and that it will not receive a vote before the years end. Will this effect the trading of some stocks? It may. But, again there was no sell off today. Particularly UNH, which has been volatile to this news, instead traded steadily higher.
It is hard to say if some of the stocks in this sector will not become range bound for some time as the news teeters back and forth. That has been the trade till now. There could be higher price action coming though.
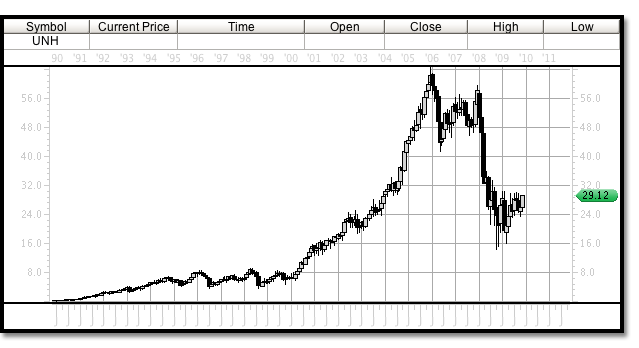
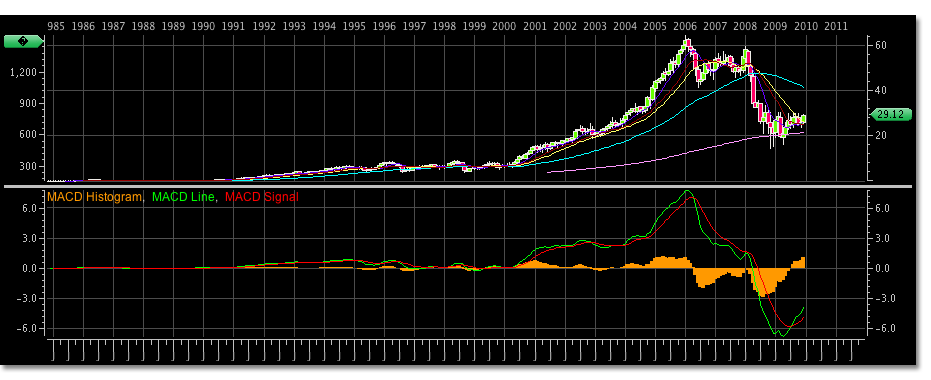
This monthly chart above shows the large uptrend that UNH has been trading in. Most recently however, from the December 1, 2005 high, UNH appears to have been in a corrective ABC wave that possibly has reached a low this past October 1, 2008. This next chart below shows the same monthly time frame with a MACD plotted below.
The largest wave observed here on the positive scale of the MACD reading can be interpreted as the wave 3 of UNH. Because UNH did not make a new price high after its MACD peaked during the December 2005 time period and the MACD reading did not create divergence to a new price high, then we can assume that UNH is in a wave 4 correction. If this is the case then there is more topside trading to come after wave 4 completes and wave 5 forms.
In either of the preceding charts you can easily point out the ABC correction that has occurred, even in the MACD itself. This is the benefit of having a stock with such a long trading history. While this picture is clear and does tell you where you may be headed, the trade in the present is not revealed unless this monthly time frame is your trading time frame. In which case you would be buying UNH on weakness anticipating a wave 5 new trading high to occur.
Only issue with long term trading is time frame itself. Perhaps UNH churns again for many years as it did between 1995 and 2001 before it breaks this trading range to this new high.
From the wave 3 high of 64.61, UNH traded lower to 42.90 completing the A wave of the correction. The B wave traded to a high of 59.46 almost spot on as a 62% retracement of wave A would have been 56.36. The C wave should have corrected to a 62% of the wave 3 magnitude, or a retracement of the preceding trend in the current zig zag correction. In this particular chart it is difficult to discern the trading levels previous to the 64.61 high to realize this wave 3 magnitude as the trading ranges were so tight to the upside and corrections were brief.
With a little bit of mathematics we could determine that the wave 2 trading low could have began at the closing price of 7.45 on March 1, 2000. This would accommodate a five wave move higher from this level to the wave 3 top. Using the 7.45 low the magnitude of the wave 3 would have been 57.19. 38% of that would be 42.88, virtually the wave A low. Now the difficult part, holding on during the wave C dive lower.
Why was the wave C low, if it has completed, so low? Almost 15.5% lower than an expected 62% correction that would have ended at 29.17 or thereabouts. Obviously the market pressures of the recession could have caused this, but where does that put UNH now?
Notice that this previously anticipated 62% retracement level has now become upward trading resistance to UNH and is only a few pennies off todays closing price. In the chart below, UNH has traded to this 30 dollar trading level almost 6 times, including todays trading, and then traded lower.
This is were everyone wants to know what to do. Sell the short term trading range that has revealed itself to the said retracement level and buy back in at lower prices. Stay long, only to watch your profits ebb and flow in this range for possibly many years. Or, stay long and watch the volatile strength that used to encompass UNH take your trade to the next wave 5 higher.
The shorter time frame has shown a new trading range already in place, to take profits here is the responsible thing to do. At a 20% gain why wouldn’t you. Although, in the near term, or future, this nice gain may be extended as market news and sentiment has recently done little to discourage the buyers. And as of late an apparent ascending triangle has formed, showing less and less room for selling as the buyers bump against the upward resistance level. This is said to be a strong reversal pattern and a bullish signal when the upper resistance is broken.
Any significant move or close above 30, with above average volume in the 20 mil range should be bought. Subsequently, if this trading range holds, and again UNH trades lower it should be bought to trade the range below. Although as the triangle closes this range will become negligible until a significant move is realized.
Of course you can not trade beyond the present whatever your time frame is. But, if this analysis of UNH is correct, keep an eye out for UNH to possibly trade to 49.70 and 71.45 if this triangle in UNH breaks to the upside. Currently the short term trading has been extended to this upside for almost 30 days. A correction could come before a breakout, but if the triangle resistance is broken the trading should prove to be profitable for the bulls.
A trade is on for UNH for the intermediate time frame and can be tracked in this link.


